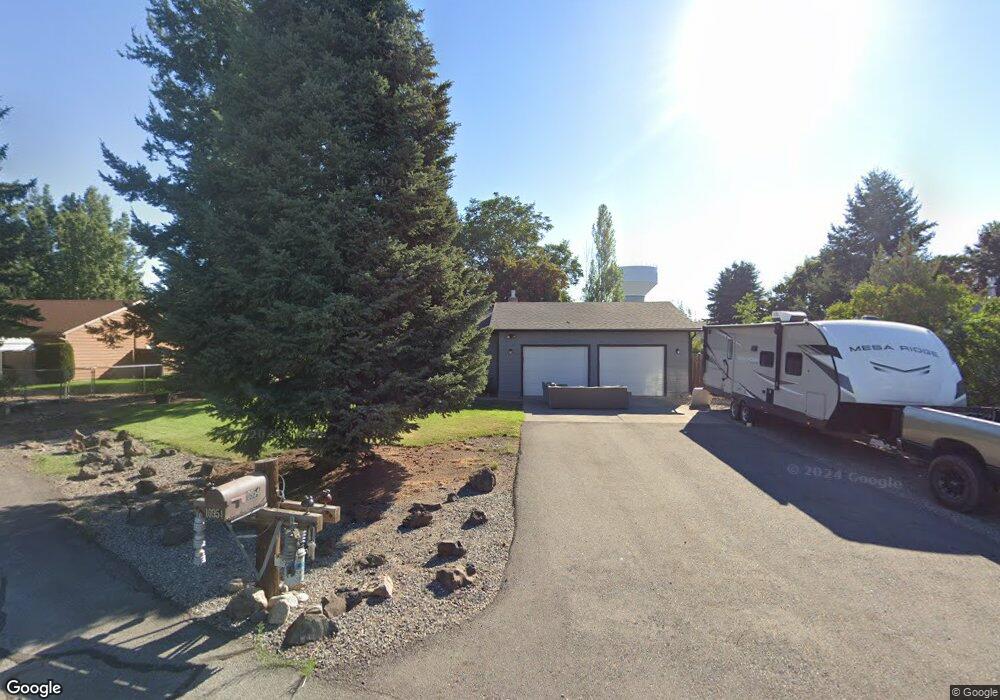
10954 N Skylark Ln Hayden, ID 83835
Estimated Value: $404,000 - $546,000
2
Beds
1
Bath
1,768
Sq Ft
$263/Sq Ft
Est. Value
About This Home
This home is located at 10954 N Skylark Ln, Hayden, ID 83835 and is currently estimated at $464,298, approximately $262 per square foot. 10954 N Skylark Ln is a home with nearby schools including Canfield Middle School, Coeur d'Alene High School, and Hayden Canyon Charter School.
Ownership History
Date
Name
Owned For
Owner Type
Purchase Details
Closed on
Apr 26, 2021
Sold by
Clark Kaylee F and Clark Colt A
Bought by
Clark Kaylee F and Clark Colt A
Current Estimated Value
Purchase Details
Closed on
Nov 1, 2017
Sold by
Kennedy Kyle R and Kennedy Denise
Bought by
Clark Colt A and Ellin Kaylee F
Home Financials for this Owner
Home Financials are based on the most recent Mortgage that was taken out on this home.
Original Mortgage
$186,558
Outstanding Balance
$159,397
Interest Rate
4.62%
Mortgage Type
FHA
Estimated Equity
$304,901
Purchase Details
Closed on
Jul 24, 2015
Sold by
Kennedy Kyle R and Kennedy Kyle R
Bought by
Kennedy Kyle R and Kennedy Denise
Home Financials for this Owner
Home Financials are based on the most recent Mortgage that was taken out on this home.
Original Mortgage
$85,000
Interest Rate
3.98%
Mortgage Type
New Conventional
Create a Home Valuation Report for This Property
The Home Valuation Report is an in-depth analysis detailing your home's value as well as a comparison with similar homes in the area
Home Values in the Area
Average Home Value in this Area
Purchase History
| Date | Buyer | Sale Price | Title Company |
|---|---|---|---|
| Clark Kaylee F | -- | Titleone Boise | |
| Clark Colt A | -- | First American Title Company | |
| Kennedy Kyle R | -- | Alliance Title Coeur D Alene |
Source: Public Records
Mortgage History
| Date | Status | Borrower | Loan Amount |
|---|---|---|---|
| Open | Clark Colt A | $186,558 | |
| Previous Owner | Kennedy Kyle R | $85,000 |
Source: Public Records
Tax History Compared to Growth
Tax History
| Year | Tax Paid | Tax Assessment Tax Assessment Total Assessment is a certain percentage of the fair market value that is determined by local assessors to be the total taxable value of land and additions on the property. | Land | Improvement |
|---|---|---|---|---|
| 2024 | $1,119 | $381,060 | $190,000 | $191,060 |
| 2023 | $1,119 | $406,344 | $200,000 | $206,344 |
| 2022 | $1,272 | $406,344 | $200,000 | $206,344 |
| 2021 | $1,068 | $267,994 | $125,000 | $142,994 |
| 2020 | $1,057 | $224,510 | $100,000 | $124,510 |
| 2019 | $1,037 | $212,120 | $95,000 | $117,120 |
| 2018 | $811 | $151,710 | $89,000 | $62,710 |
| 2017 | $784 | $136,240 | $74,520 | $61,720 |
| 2016 | $739 | $122,080 | $62,100 | $59,980 |
| 2015 | $733 | $118,360 | $54,000 | $64,360 |
| 2013 | $703 | $105,560 | $36,800 | $68,760 |
Source: Public Records
Map
Nearby Homes
- 11191 N Jonathan Ave
- 11093 N Falkirk St Unit 6
- 749 W Oklahoma Ave
- 647 W Kentucky Ave
- 741 W Kentucky Ave
- 10734 N Benoit St
- 10660 N Benoit St
- 10739 N Benoit St
- 10600 N Benoit St
- 11474 N Alaska Loop
- 11239 N Crusader St
- 198 E Lobo Loop
- 206 E Lobo Loop
- 228 E Lobo Loop
- 236 E Lobo Loop
- 218 E Lobo Loop
- 222 E Lobo Loop
- 10393 N Kender Ln
- 10684 N Barcelona St
- 297 E Grosbeak Ave
- 10926 N Skylark Ln
- 10964 N Skylark Ln
- 10951 N Krest Ct
- 10967 N Krest Ct
- 10890 N Skylark Ln
- 10929 N Krest Ct
- 10953 N Skylark Ln
- 618 W Peach Tree Dr
- 10945 N Skylark Ln
- 588 W Peach Tree Dr
- 10969 N Skylark Ln
- 10977 N Krest Ct
- 10893 N Krest Ct
- 10893 N Krest Ct
- 10891 N Skylark Ln
- 10876 N Skylark Ln
- 650 W Peach Tree Dr
- 560 W Peach Tree Dr
- 0 W Peach Tree Dr
- 10875 N Krest Ct