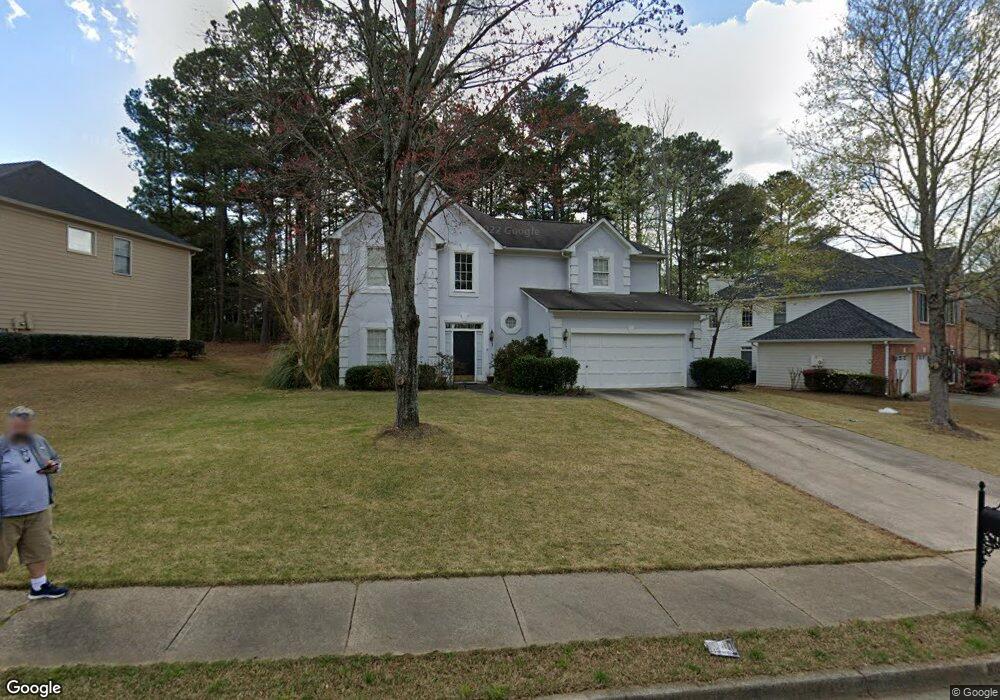
10955 Glenhurst Pass Duluth, GA 30097
Estimated Value: $499,000 - $595,000
3
Beds
3
Baths
1,833
Sq Ft
$306/Sq Ft
Est. Value
About This Home
This home is located at 10955 Glenhurst Pass, Duluth, GA 30097 and is currently estimated at $561,139, approximately $306 per square foot. 10955 Glenhurst Pass is a home located in Fulton County with nearby schools including Wilson Creek Elementary School, River Trail Middle School, and Northview High School.
Ownership History
Date
Name
Owned For
Owner Type
Purchase Details
Closed on
Jul 1, 2005
Sold by
Salisbury Kevin M
Bought by
Ghaffari Jamaledin
Current Estimated Value
Home Financials for this Owner
Home Financials are based on the most recent Mortgage that was taken out on this home.
Original Mortgage
$179,655
Outstanding Balance
$93,236
Interest Rate
5.57%
Mortgage Type
VA
Estimated Equity
$467,903
Purchase Details
Closed on
May 21, 2003
Sold by
Schmidt Peter A and Schmidt Janeen C
Bought by
Salisbury Kevin M
Home Financials for this Owner
Home Financials are based on the most recent Mortgage that was taken out on this home.
Original Mortgage
$166,000
Interest Rate
5.79%
Mortgage Type
New Conventional
Purchase Details
Closed on
Mar 28, 1997
Sold by
The Ryland Group Inc
Bought by
Schmidt Peter A and Schmidt Janeen
Home Financials for this Owner
Home Financials are based on the most recent Mortgage that was taken out on this home.
Original Mortgage
$144,000
Interest Rate
7.86%
Mortgage Type
New Conventional
Create a Home Valuation Report for This Property
The Home Valuation Report is an in-depth analysis detailing your home's value as well as a comparison with similar homes in the area
Home Values in the Area
Average Home Value in this Area
Purchase History
| Date | Buyer | Sale Price | Title Company |
|---|---|---|---|
| Ghaffari Jamaledin | $224,500 | -- | |
| Salisbury Kevin M | $207,600 | -- | |
| Schmidt Peter A | $160,300 | -- |
Source: Public Records
Mortgage History
| Date | Status | Borrower | Loan Amount |
|---|---|---|---|
| Open | Ghaffari Jamaledin | $179,655 | |
| Previous Owner | Salisbury Kevin M | $166,000 | |
| Previous Owner | Schmidt Peter A | $144,000 |
Source: Public Records
Tax History Compared to Growth
Tax History
| Year | Tax Paid | Tax Assessment Tax Assessment Total Assessment is a certain percentage of the fair market value that is determined by local assessors to be the total taxable value of land and additions on the property. | Land | Improvement |
|---|---|---|---|---|
| 2025 | $3,239 | $234,840 | $92,560 | $142,280 |
| 2023 | $3,239 | $191,480 | $56,960 | $134,520 |
| 2022 | $3,097 | $154,160 | $42,600 | $111,560 |
| 2021 | $3,057 | $122,480 | $29,720 | $92,760 |
| 2020 | $3,077 | $121,000 | $29,360 | $91,640 |
| 2019 | $364 | $123,240 | $31,160 | $92,080 |
| 2018 | $3,381 | $120,320 | $30,400 | $89,920 |
| 2017 | $2,976 | $99,600 | $22,560 | $77,040 |
| 2016 | $2,925 | $99,600 | $22,560 | $77,040 |
| 2015 | $2,957 | $99,600 | $22,560 | $77,040 |
| 2014 | $3,053 | $99,600 | $22,560 | $77,040 |
Source: Public Records
Map
Nearby Homes
- 10950 Glenhurst Pass
- 4243 Baden Alley
- 10840 Yorkwood St
- 10844 Yorkwood St
- 10595 Highgate Manor Ct
- 11065 Brunson Dr Unit 247
- 540 Abbotts Mill Dr
- 755 Abbotts Mill Ct Unit 69
- 5765 Bailey Ridge Ct
- 10567 Bent Tree View
- 6126 Narcissa Place
- 11035 Parsons Rd
- 11041 Parsons Rd
- 5640 Sandown Way
- 5690 Abbotts Bridge Rd
- 6273 Clapham Ln
- 225 Lazy Shade Ct Unit 1B
- 10965 Glenhurst Pass
- 10945 Glenhurst Pass
- 10975 Glenhurst Pass
- 10935 Glenhurst Pass
- 565 Dorchester Crossing
- 575 Dorchester Crossing
- 10985 Glenhurst Pass
- 11030 Glenhurst Pass
- 11010 Glenhurst Pass
- 11040 Glenhurst Pass
- 11020 Glenhurst Pass
- 10925 Glenhurst Pass
- 11000 Glenhurst Pass
- 10990 Glenhurst Pass
- 11050 Glenhurst Pass
- 210 Windsor Chase Trail
- 10995 Glenhurst Pass
- 555 Dorchester Crossing
- 585 Dorchester Crossing
- 460 Victorian Ln