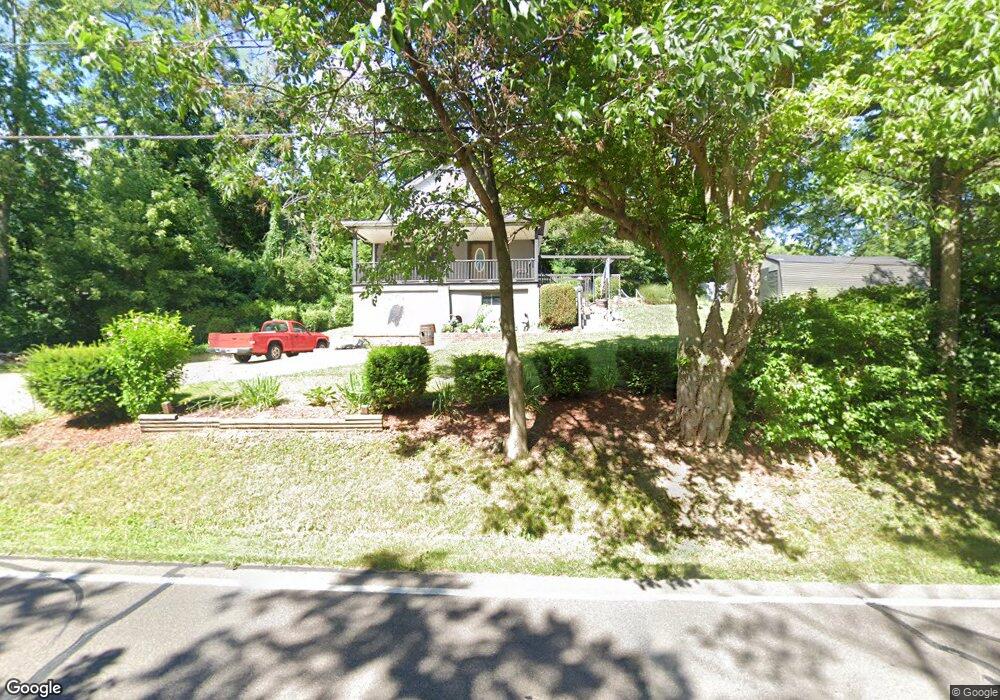
1096 Devils Backbone Rd Cincinnati, OH 45233
Cotillion Village NeighborhoodEstimated Value: $144,000 - $189,000
1
Bed
1
Bath
937
Sq Ft
$177/Sq Ft
Est. Value
About This Home
This home is located at 1096 Devils Backbone Rd, Cincinnati, OH 45233 and is currently estimated at $165,677, approximately $176 per square foot. 1096 Devils Backbone Rd is a home located in Hamilton County with nearby schools including John Foster Dulles Elementary School, Rapid Run Middle School, and Oak Hills High School.
Ownership History
Date
Name
Owned For
Owner Type
Purchase Details
Closed on
Feb 12, 1998
Sold by
Linman E Kelly and Linman Janice K
Bought by
Sickman David T
Current Estimated Value
Home Financials for this Owner
Home Financials are based on the most recent Mortgage that was taken out on this home.
Original Mortgage
$56,970
Outstanding Balance
$8,785
Interest Rate
6.99%
Mortgage Type
FHA
Estimated Equity
$156,892
Create a Home Valuation Report for This Property
The Home Valuation Report is an in-depth analysis detailing your home's value as well as a comparison with similar homes in the area
Home Values in the Area
Average Home Value in this Area
Purchase History
| Date | Buyer | Sale Price | Title Company |
|---|---|---|---|
| Sickman David T | $57,000 | -- |
Source: Public Records
Mortgage History
| Date | Status | Borrower | Loan Amount |
|---|---|---|---|
| Open | Sickman David T | $56,970 |
Source: Public Records
Tax History
| Year | Tax Paid | Tax Assessment Tax Assessment Total Assessment is a certain percentage of the fair market value that is determined by local assessors to be the total taxable value of land and additions on the property. | Land | Improvement |
|---|---|---|---|---|
| 2025 | $2,516 | $41,077 | $19,366 | $21,711 |
| 2023 | $2,485 | $41,077 | $19,366 | $21,711 |
| 2022 | $2,085 | $30,650 | $17,966 | $12,684 |
| 2021 | $2,083 | $30,650 | $17,966 | $12,684 |
| 2020 | $2,062 | $30,650 | $17,966 | $12,684 |
| 2019 | $1,987 | $26,422 | $15,488 | $10,934 |
| 2018 | $1,988 | $26,422 | $15,488 | $10,934 |
| 2017 | $1,823 | $26,422 | $15,488 | $10,934 |
| 2016 | $2,090 | $30,069 | $15,526 | $14,543 |
| 2015 | $2,065 | $30,069 | $15,526 | $14,543 |
| 2014 | $2,064 | $30,069 | $15,526 | $14,543 |
| 2013 | $2,092 | $32,333 | $16,695 | $15,638 |
Source: Public Records
Map
Nearby Homes
- 5949 Cleves Warsaw Pike
- 6009 Cleves Warsaw Pike
- 837 Neeb Rd
- 1006 Pineknot Dr
- 5664 Rapid Run Rd
- 5789 Juvene Way
- 712 Libbejo Dr
- 5773 Fourson Dr
- 5671 Julmar Dr
- 5528 Cove Ct
- 625 Conina Dr
- 5466 Gwendolyn Ridge
- 1659 Devils Backbone Rd
- 5496 Gwendolyn Ridge
- 1287 Heather Ridge
- 571 Libbejo Dr
- 1711 Ebenezer Rd
- 6278 Gardenlake Ct
- 5749 Beech Grove Ln
- 1259 Wexford Ln
- 1080 Devils Backbone Rd
- 1114 Balmoral Dr
- 1102 Balmoral Dr
- 5901 Hickoryknoll Dr
- 1126 Balmoral Dr
- 5907 Hickoryknoll Dr
- 1068 Devils Backbone Rd
- 1113 Balmoral Dr
- 1138 Balmoral Dr
- 1123 Balmoral Dr
- 1141 Devils Backbone Rd
- 1107 Devils Backbone Rd
- 5915 Hickoryknoll Dr
- 1135 Balmoral Dr
- 1150 Balmoral Dr
- 5910 Hickoryknoll Dr
- 1111 Devils Backbone Rd
- 1062 Devils Backbone Rd
- 1149 Devils Backbone Rd
- 1075 Devils Backbone Rd
Your Personal Tour Guide
Ask me questions while you tour the home.