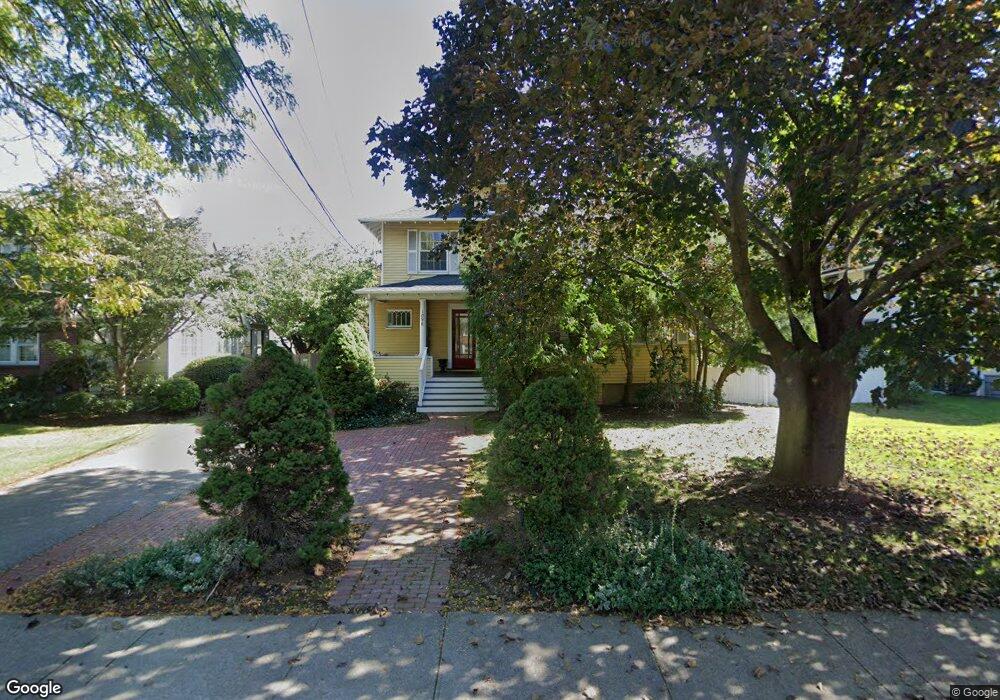
1096 Highland Ave Needham Heights, MA 02494
Estimated Value: $1,226,093 - $1,849,000
4
Beds
2
Baths
1,596
Sq Ft
$882/Sq Ft
Est. Value
About This Home
This home is located at 1096 Highland Ave, Needham Heights, MA 02494 and is currently estimated at $1,407,523, approximately $881 per square foot. 1096 Highland Ave is a home located in Norfolk County with nearby schools including Sunita L. Williams Elementary School, High Rock Middle School, and Pollard Middle School.
Ownership History
Date
Name
Owned For
Owner Type
Purchase Details
Closed on
Oct 3, 2013
Sold by
Daly John J and Daly Eileen E
Bought by
Daly John J and Daly Eileen E
Current Estimated Value
Home Financials for this Owner
Home Financials are based on the most recent Mortgage that was taken out on this home.
Original Mortgage
$560,000
Outstanding Balance
$421,337
Interest Rate
4.61%
Mortgage Type
Purchase Money Mortgage
Estimated Equity
$986,186
Purchase Details
Closed on
Sep 16, 2005
Sold by
Jean Amy Z and Jean Paul-Johan
Bought by
Daly Eileen E and Daly John J
Home Financials for this Owner
Home Financials are based on the most recent Mortgage that was taken out on this home.
Original Mortgage
$635,625
Interest Rate
5.84%
Mortgage Type
Purchase Money Mortgage
Purchase Details
Closed on
Jul 20, 2001
Sold by
Mitrano Laura P and Mitrano James L
Bought by
Jean Paul J and Jean Amy Z
Purchase Details
Closed on
Sep 27, 1996
Sold by
Highland Ave Rt
Bought by
Mitrano James L and Mitrano Laura P
Create a Home Valuation Report for This Property
The Home Valuation Report is an in-depth analysis detailing your home's value as well as a comparison with similar homes in the area
Home Values in the Area
Average Home Value in this Area
Purchase History
| Date | Buyer | Sale Price | Title Company |
|---|---|---|---|
| Daly John J | -- | -- | |
| Daly John J | -- | -- | |
| Daly John J | -- | -- | |
| Daly Eileen E | $847,500 | -- | |
| Daly Eileen E | $847,500 | -- | |
| Jean Paul J | $660,000 | -- | |
| Mitrano James L | $290,000 | -- | |
| Mitrano James L | $290,000 | -- |
Source: Public Records
Mortgage History
| Date | Status | Borrower | Loan Amount |
|---|---|---|---|
| Open | Daly John J | $560,000 | |
| Closed | Mitrano James L | $560,000 | |
| Previous Owner | Daly Eileen E | $635,625 |
Source: Public Records
Tax History Compared to Growth
Tax History
| Year | Tax Paid | Tax Assessment Tax Assessment Total Assessment is a certain percentage of the fair market value that is determined by local assessors to be the total taxable value of land and additions on the property. | Land | Improvement |
|---|---|---|---|---|
| 2025 | $11,097 | $1,046,900 | $700,900 | $346,000 |
| 2024 | $10,829 | $864,900 | $556,200 | $308,700 |
| 2023 | $10,939 | $838,900 | $556,200 | $282,700 |
| 2022 | $10,161 | $760,000 | $488,400 | $271,600 |
| 2021 | $9,903 | $760,000 | $488,400 | $271,600 |
| 2020 | $9,750 | $780,600 | $488,400 | $292,200 |
| 2019 | $9,037 | $729,400 | $444,400 | $285,000 |
| 2018 | $8,665 | $729,400 | $444,400 | $285,000 |
| 2017 | $8,235 | $692,600 | $444,400 | $248,200 |
| 2016 | $8,039 | $696,600 | $444,400 | $252,200 |
| 2015 | $7,865 | $696,600 | $444,400 | $252,200 |
| 2014 | $7,502 | $644,500 | $404,400 | $240,100 |
Source: Public Records
Map
Nearby Homes
- 60 Rosemary St
- 445 Hillside Ave
- 609 Hunnewell St
- 14 Lasalle Rd
- 638 Webster St
- 638 Webster St Unit 638
- 39 Donna Rd
- 27 Concord St
- 77 High St
- 403 Hunnewell St Unit 403
- 28 Mercer Rd
- 719 Webster St
- 30 Gibson St
- 400 Hunnewell St Unit 103
- 379 Hunnewell St Unit 379
- 381 Hunnewell St Unit 381
- 132 Hillside Ave
- 306 Manning St
- 190 Brookline St
- 42 Otis St Unit R
- 1096 Highland Ave Unit 2
- 1096 Highland Ave Unit 1096
- 1096 Highland Ave Unit 1
- 1092 Highland Ave
- 1102 Highland Ave
- 1102 Highland Ave Unit 1
- 64 Carey Rd
- 1082 Highland Ave
- 1095 Highland Ave
- 1112 Highland Ave
- 1091 Highland Ave Unit 1
- 1091 Highland Ave
- 48 Trueman St
- 61 Carey Rd
- 41 Trueman St
- 1076 Highland Ave
- 1081 Highland Ave
- 54 Carey Rd
- 53 Carey Rd
- 53 Carey Rd