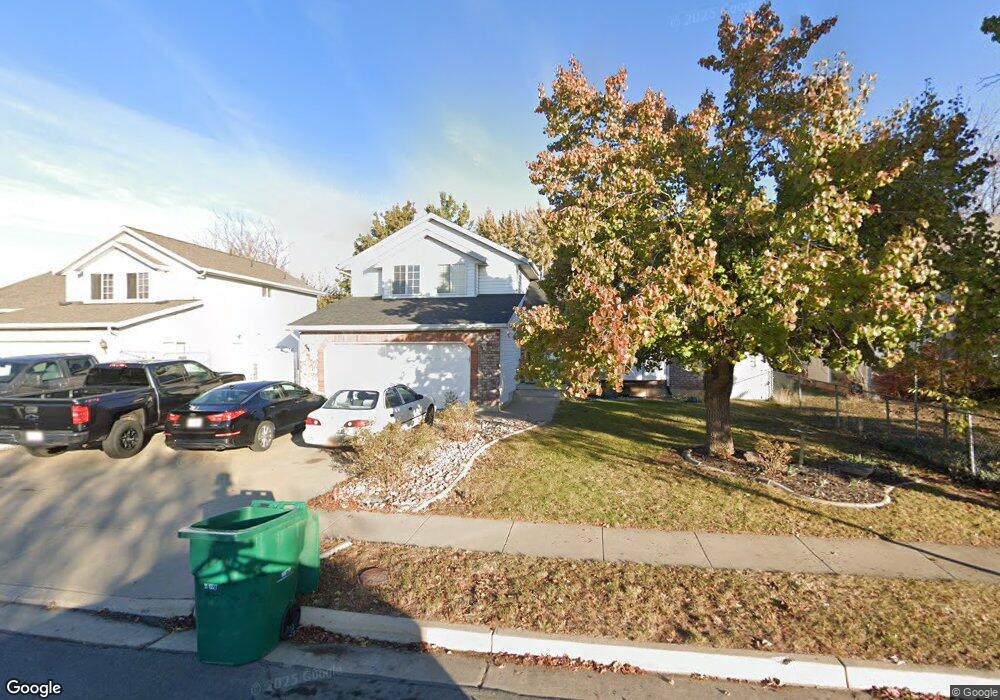
1096 N 2725 W Layton, UT 84041
Estimated Value: $493,000 - $527,000
5
Beds
4
Baths
2,324
Sq Ft
$221/Sq Ft
Est. Value
About This Home
This home is located at 1096 N 2725 W, Layton, UT 84041 and is currently estimated at $513,760, approximately $221 per square foot. 1096 N 2725 W is a home located in Davis County with nearby schools including Legacy Junior High School, Layton High School, and North Davis Preparatory Academy.
Ownership History
Date
Name
Owned For
Owner Type
Purchase Details
Closed on
Jan 22, 2013
Sold by
Secretary Of Vetrans Affairs
Bought by
American Homes 4 Rent Lp
Current Estimated Value
Purchase Details
Closed on
Jun 2, 2012
Sold by
Gmac Mortgage Llc
Bought by
Secretary Of Veterans Affairs
Purchase Details
Closed on
May 8, 2012
Sold by
Haugen Dennis D and Haugen Michelle D
Bought by
Gmac Mortgage Llc
Purchase Details
Closed on
Nov 14, 2007
Sold by
Johnson A Kim and Johnson Denise D
Bought by
Haugen Dennis G and Haugen Michelle D
Home Financials for this Owner
Home Financials are based on the most recent Mortgage that was taken out on this home.
Original Mortgage
$212,000
Interest Rate
6.35%
Mortgage Type
VA
Create a Home Valuation Report for This Property
The Home Valuation Report is an in-depth analysis detailing your home's value as well as a comparison with similar homes in the area
Home Values in the Area
Average Home Value in this Area
Purchase History
| Date | Buyer | Sale Price | Title Company |
|---|---|---|---|
| American Homes 4 Rent Lp | $162,000 | None Available | |
| Secretary Of Veterans Affairs | -- | Trustees Title & Esc | |
| Gmac Mortgage Llc | $141,008 | Trustees Title | |
| Haugen Dennis G | -- | First American Title |
Source: Public Records
Mortgage History
| Date | Status | Borrower | Loan Amount |
|---|---|---|---|
| Previous Owner | Haugen Dennis G | $212,000 |
Source: Public Records
Tax History Compared to Growth
Tax History
| Year | Tax Paid | Tax Assessment Tax Assessment Total Assessment is a certain percentage of the fair market value that is determined by local assessors to be the total taxable value of land and additions on the property. | Land | Improvement |
|---|---|---|---|---|
| 2025 | $2,552 | $267,850 | $97,506 | $170,344 |
| 2024 | $2,465 | $260,699 | $110,497 | $150,202 |
| 2023 | $2,339 | $239,800 | $57,267 | $182,532 |
| 2022 | $2,554 | $470,000 | $124,803 | $345,197 |
| 2021 | $2,299 | $347,000 | $103,013 | $243,987 |
| 2020 | $2,072 | $300,000 | $85,650 | $214,350 |
| 2019 | $2,009 | $285,000 | $90,632 | $194,368 |
| 2018 | $1,805 | $257,000 | $79,180 | $177,820 |
| 2016 | $1,545 | $113,520 | $29,725 | $83,795 |
| 2015 | $1,461 | $101,915 | $29,725 | $72,190 |
| 2014 | $1,565 | $111,570 | $29,725 | $81,845 |
| 2013 | -- | $107,991 | $28,952 | $79,039 |
Source: Public Records
Map
Nearby Homes