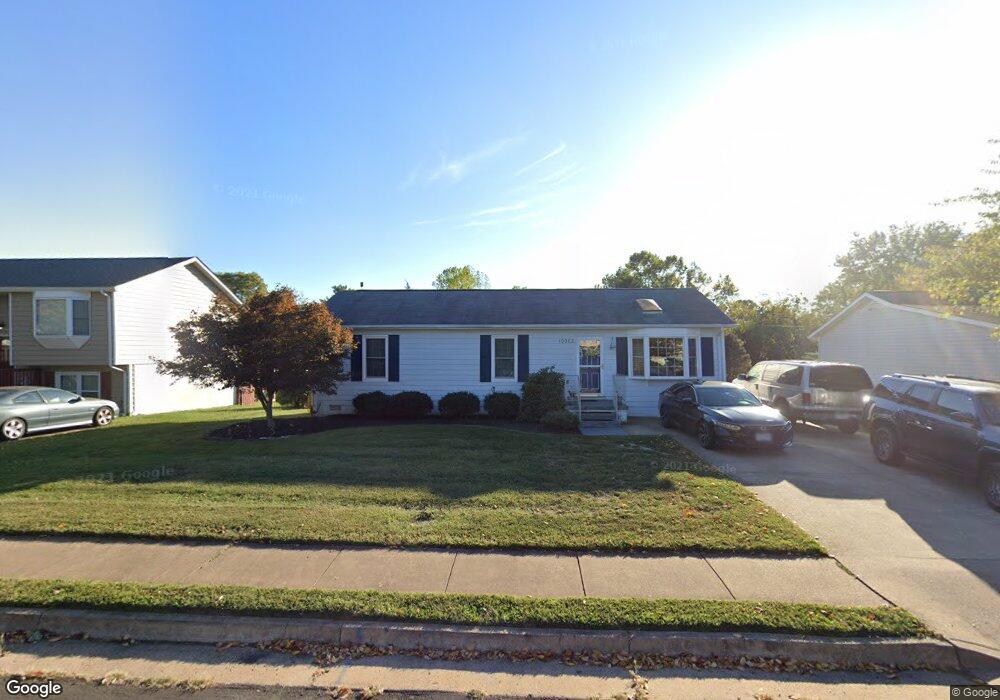
10962 Blake Ln Bealeton, VA 22712
Estimated Value: $392,000 - $408,000
3
Beds
2
Baths
1,104
Sq Ft
$363/Sq Ft
Est. Value
About This Home
This home is located at 10962 Blake Ln, Bealeton, VA 22712 and is currently estimated at $401,050, approximately $363 per square foot. 10962 Blake Ln is a home located in Fauquier County with nearby schools including Grace Miller Elementary School, W.C. Taylor Middle School, and Liberty High School.
Ownership History
Date
Name
Owned For
Owner Type
Purchase Details
Closed on
May 26, 2017
Sold by
Vowels David S and Vowels Jennifer L
Bought by
Vowels Jennifer L
Current Estimated Value
Purchase Details
Closed on
Aug 27, 2002
Sold by
Fleming John D
Bought by
Vowles David S
Home Financials for this Owner
Home Financials are based on the most recent Mortgage that was taken out on this home.
Original Mortgage
$145,300
Outstanding Balance
$62,156
Interest Rate
6.57%
Estimated Equity
$338,894
Purchase Details
Closed on
Dec 13, 1995
Sold by
Sec Hud
Bought by
Fleming John D
Home Financials for this Owner
Home Financials are based on the most recent Mortgage that was taken out on this home.
Original Mortgage
$92,140
Interest Rate
7.43%
Purchase Details
Closed on
Aug 31, 1995
Sold by
Haines By Te Rh
Bought by
Sec Hud
Create a Home Valuation Report for This Property
The Home Valuation Report is an in-depth analysis detailing your home's value as well as a comparison with similar homes in the area
Home Values in the Area
Average Home Value in this Area
Purchase History
| Date | Buyer | Sale Price | Title Company |
|---|---|---|---|
| Vowels Jennifer L | -- | None Available | |
| Vowles David S | $146,500 | -- | |
| Fleming John D | $92,900 | -- | |
| Sec Hud | $141,554 | -- |
Source: Public Records
Mortgage History
| Date | Status | Borrower | Loan Amount |
|---|---|---|---|
| Open | Vowles David S | $145,300 | |
| Previous Owner | Sec Hud | $92,140 |
Source: Public Records
Tax History Compared to Growth
Tax History
| Year | Tax Paid | Tax Assessment Tax Assessment Total Assessment is a certain percentage of the fair market value that is determined by local assessors to be the total taxable value of land and additions on the property. | Land | Improvement |
|---|---|---|---|---|
| 2025 | $2,691 | $278,300 | $110,000 | $168,300 |
| 2024 | $2,638 | $278,300 | $110,000 | $168,300 |
| 2023 | $2,527 | $278,300 | $110,000 | $168,300 |
| 2022 | $2,527 | $278,300 | $110,000 | $168,300 |
| 2021 | $2,027 | $202,600 | $100,000 | $102,600 |
| 2020 | $2,027 | $202,600 | $100,000 | $102,600 |
| 2019 | $2,027 | $202,600 | $100,000 | $102,600 |
| 2018 | $2,003 | $202,600 | $100,000 | $102,600 |
| 2016 | $1,749 | $167,000 | $85,000 | $82,000 |
| 2015 | -- | $167,000 | $85,000 | $82,000 |
| 2014 | -- | $167,000 | $85,000 | $82,000 |
Source: Public Records
Map
Nearby Homes
- 2936 Revere St
- 6739 Huntland Dr
- 7534 Hancock St
- 4092 Clarke St
- 6628 Belfrys Ct W
- 1080 Winter Place
- 6559 Belfrys Ct E
- 1070 Winter Place
- 1088 Winter Place
- 1078 Winter Place
- 1074 Winter Place
- 1084 Winter Place
- 1066 Winter Place
- 1075 Winter Place
- 2067 Springvale Dr
- 2076 Springvale Dr
- 2075 Springvale Dr
- 2080 Springvale Dr
- 2083 Springvale Dr
- 4142 Foxhaven Dr