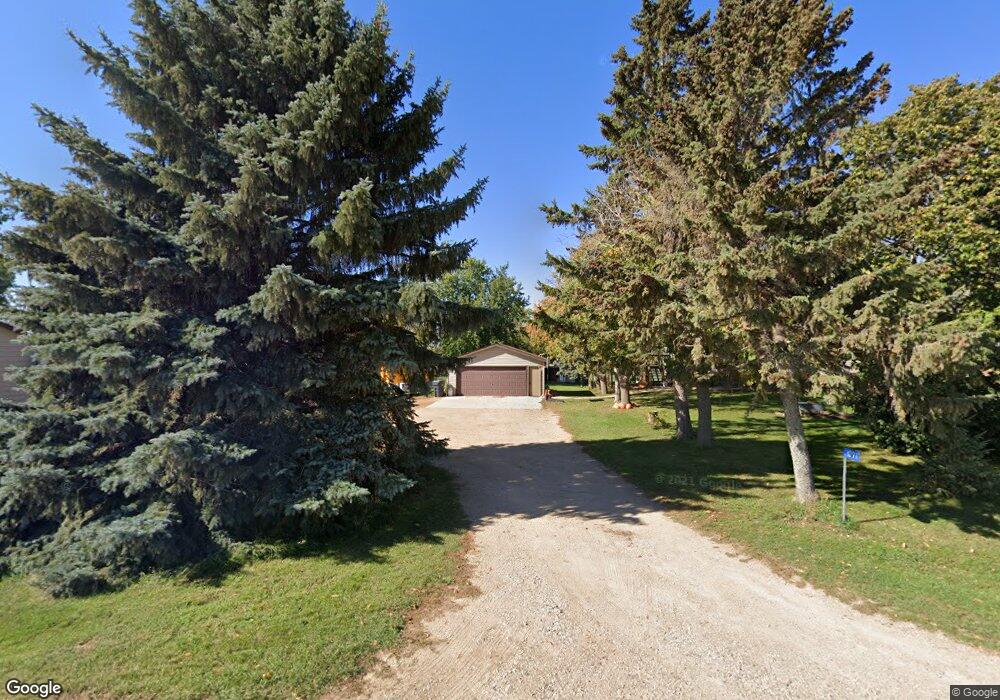
1097 60th Ave Pipestone, MN 56164
Estimated Value: $259,983 - $408,000
Studio
--
Bath
--
Sq Ft
142,006
Sq Ft Lot
About This Home
This home is located at 1097 60th Ave, Pipestone, MN 56164 and is currently estimated at $325,996. 1097 60th Ave is a home located in Pipestone County with nearby schools including Pipestone Elementary School, Brown Elementary School, and Pipestone Head Start.
Ownership History
Date
Name
Owned For
Owner Type
Purchase Details
Closed on
Nov 13, 2016
Sold by
Stueven Dallas and Stueven Rebecca
Bought by
Dengler Edison L and Dengler Lynn H
Current Estimated Value
Home Financials for this Owner
Home Financials are based on the most recent Mortgage that was taken out on this home.
Original Mortgage
$182,238
Outstanding Balance
$148,345
Interest Rate
3.87%
Mortgage Type
FHA
Estimated Equity
$177,651
Create a Home Valuation Report for This Property
The Home Valuation Report is an in-depth analysis detailing your home's value as well as a comparison with similar homes in the area
Home Values in the Area
Average Home Value in this Area
Purchase History
| Date | Buyer | Sale Price | Title Company |
|---|---|---|---|
| Dengler Edison L | $185,600 | Pipestone Abstract |
Source: Public Records
Mortgage History
| Date | Status | Borrower | Loan Amount |
|---|---|---|---|
| Open | Dengler Edison L | $182,238 |
Source: Public Records
Tax History
| Year | Tax Paid | Tax Assessment Tax Assessment Total Assessment is a certain percentage of the fair market value that is determined by local assessors to be the total taxable value of land and additions on the property. | Land | Improvement |
|---|---|---|---|---|
| 2025 | $1,534 | $249,400 | $39,100 | $210,300 |
| 2024 | $1,534 | $255,200 | $44,100 | $211,100 |
| 2023 | $1,362 | $234,800 | $35,100 | $199,700 |
| 2022 | $1,298 | $204,300 | $35,100 | $169,200 |
| 2021 | $1,350 | $181,900 | $33,700 | $148,200 |
| 2020 | $1,302 | $182,100 | $33,700 | $148,400 |
| 2019 | $1,110 | $175,700 | $31,200 | $144,500 |
| 2018 | $1,056 | $154,900 | $30,700 | $124,200 |
| 2017 | $1,122 | $150,800 | $30,700 | $120,100 |
| 2016 | $980 | $0 | $0 | $0 |
| 2015 | $962 | $108,300 | $22,633 | $85,667 |
| 2014 | $962 | $109,300 | $21,714 | $87,586 |
Source: Public Records
Map
Nearby Homes
Your Personal Tour Guide
Ask me questions while you tour the home.