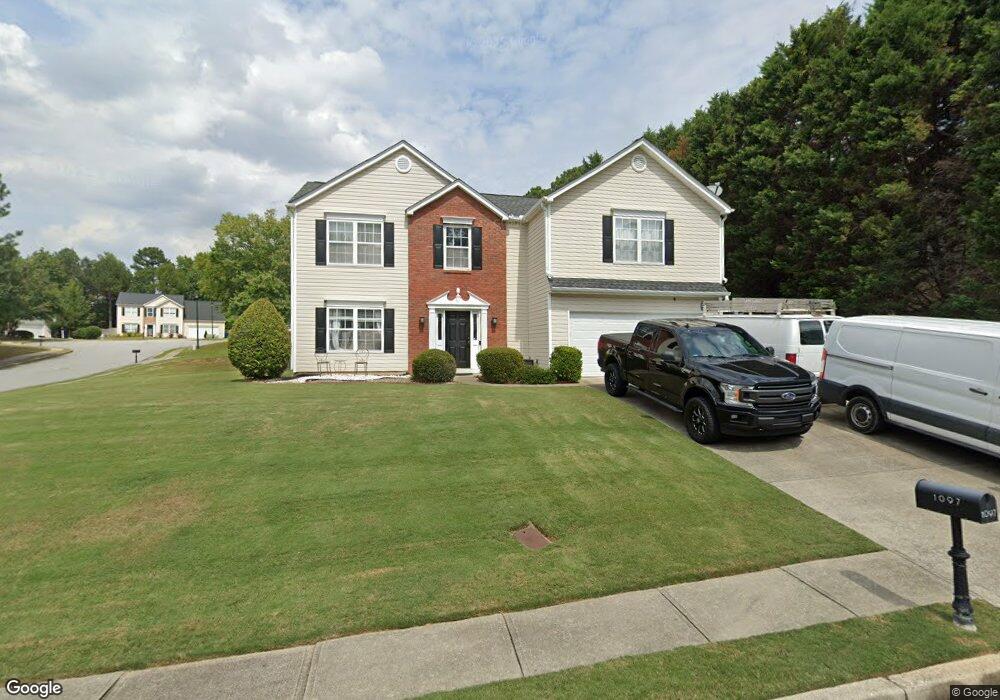
1097 Eastmill Cove Unit 4 Dacula, GA 30019
Estimated Value: $372,000 - $408,000
4
Beds
2
Baths
2,192
Sq Ft
$177/Sq Ft
Est. Value
About This Home
This home is located at 1097 Eastmill Cove Unit 4, Dacula, GA 30019 and is currently estimated at $387,773, approximately $176 per square foot. 1097 Eastmill Cove Unit 4 is a home located in Gwinnett County with nearby schools including Dacula Elementary School, Dacula Middle School, and Dacula High School.
Ownership History
Date
Name
Owned For
Owner Type
Purchase Details
Closed on
Aug 22, 2022
Sold by
Martin Wendy San
Bought by
Martin Jair San
Current Estimated Value
Purchase Details
Closed on
Jul 24, 2012
Sold by
Figueroa Jair S
Bought by
Martin Wendy San and Figueroa Jair S
Purchase Details
Closed on
Aug 30, 2006
Sold by
Donlon Robert T
Bought by
Figueroa Jair S
Home Financials for this Owner
Home Financials are based on the most recent Mortgage that was taken out on this home.
Original Mortgage
$163,875
Interest Rate
10.25%
Mortgage Type
New Conventional
Purchase Details
Closed on
Jul 15, 1999
Sold by
Cherokee Homes Lp
Bought by
Donlon Robert T
Home Financials for this Owner
Home Financials are based on the most recent Mortgage that was taken out on this home.
Original Mortgage
$130,450
Interest Rate
7.89%
Mortgage Type
FHA
Create a Home Valuation Report for This Property
The Home Valuation Report is an in-depth analysis detailing your home's value as well as a comparison with similar homes in the area
Home Values in the Area
Average Home Value in this Area
Purchase History
| Date | Buyer | Sale Price | Title Company |
|---|---|---|---|
| Martin Jair San | -- | -- | |
| Martin Wendy San | -- | -- | |
| Figueroa Jair S | $172,500 | -- | |
| Donlon Robert T | $131,600 | -- |
Source: Public Records
Mortgage History
| Date | Status | Borrower | Loan Amount |
|---|---|---|---|
| Previous Owner | Figueroa Jair S | $163,875 | |
| Previous Owner | Donlon Robert T | $130,450 |
Source: Public Records
Tax History Compared to Growth
Tax History
| Year | Tax Paid | Tax Assessment Tax Assessment Total Assessment is a certain percentage of the fair market value that is determined by local assessors to be the total taxable value of land and additions on the property. | Land | Improvement |
|---|---|---|---|---|
| 2025 | $4,530 | $148,080 | $30,000 | $118,080 |
| 2024 | $4,491 | $139,720 | $31,200 | $108,520 |
| 2023 | $4,491 | $142,560 | $31,200 | $111,360 |
| 2022 | $4,204 | $127,720 | $26,000 | $101,720 |
| 2021 | $3,808 | $95,880 | $21,200 | $74,680 |
| 2020 | $3,509 | $87,040 | $18,400 | $68,640 |
| 2019 | $3,378 | $87,040 | $18,400 | $68,640 |
| 2018 | $3,264 | $83,760 | $14,800 | $68,960 |
| 2016 | $2,819 | $70,560 | $12,800 | $57,760 |
| 2015 | $2,680 | $65,880 | $11,200 | $54,680 |
| 2014 | $2,694 | $65,880 | $11,200 | $54,680 |
Source: Public Records
Map
Nearby Homes
- 2944 Jasmine Brook Ct
- 3100 Evergreen Eve Crossing
- 1200 Evergreen Oak Way
- 2905 The Terraces Way
- 1090 River Valley Dr
- 2875 Old Fountain Rd
- 2681 Conifer Green Way
- 1355 Auburn Rd
- 1345 Auburn Rd
- 1335 Auburn Glen Rd
- 1365 Auburn Rd
- 1375 Auburn Rd
- 1345 Auburn Glen Rd
- 1355 Auburn Glen Rd
- 2848 Belfaire Lake Dr
- 1385 Auburn Rd
- 1385 Auburn Glen Rd
- 3197 Eastham Run Dr
- 2913 Holly Green Way
- 1077 Eastmill Cove
- 0 Eastmill Cove Unit 7488498
- 0 Eastmill Cove Unit 7482265
- 0 Eastmill Cove Unit 8663791
- 0 Eastmill Cove Unit 8291850
- 0 Eastmill Cove Unit 7354637
- 0 Holly Green Ct Unit 9002628
- 0 Eastmill Cove Unit 8771544
- 0 Eastmill Cove Unit 8884778
- 0 Holly Green Ct Unit 8904770
- 0 Eastmill Cove Unit 3140013
- 0 Holly Green Ct Unit 7070730
- 0 Eastmill Cove Unit 7079905
- 0 Eastmill Cove Unit 7274437
- 0 Holly Green Ct Unit 7329050
- 0 Eastmill Cove Unit 7402064
- 0 Eastmill Cove
- 1092 Eastmill Cove Unit 4
- 1117 Eastmill Cove