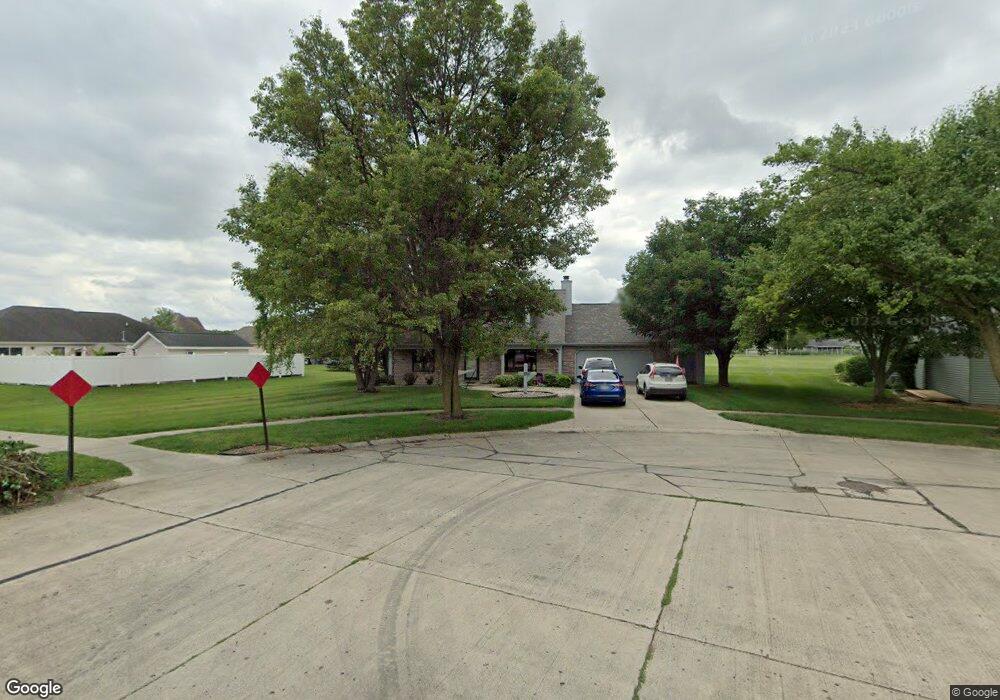
1097 Maxine Ln van Wert, OH 45891
Estimated Value: $270,013 - $303,000
3
Beds
2
Baths
1,944
Sq Ft
$149/Sq Ft
Est. Value
About This Home
This home is located at 1097 Maxine Ln, van Wert, OH 45891 and is currently estimated at $290,253, approximately $149 per square foot. 1097 Maxine Ln is a home located in Van Wert County with nearby schools including Van Wert Early Childhood Center, Van Wert High School, and Lifelinks Community School.
Ownership History
Date
Name
Owned For
Owner Type
Purchase Details
Closed on
Nov 17, 2011
Sold by
Bidlack Mark A and Bidlack Kay A
Bought by
Weir Peter H and Weir Susan J
Current Estimated Value
Home Financials for this Owner
Home Financials are based on the most recent Mortgage that was taken out on this home.
Original Mortgage
$128,500
Interest Rate
3.97%
Mortgage Type
New Conventional
Purchase Details
Closed on
Apr 26, 2006
Sold by
Schreiner Lynette M
Bought by
Bidlack Mark A
Home Financials for this Owner
Home Financials are based on the most recent Mortgage that was taken out on this home.
Original Mortgage
$119,000
Interest Rate
6.42%
Mortgage Type
Future Advance Clause Open End Mortgage
Purchase Details
Closed on
Apr 28, 2004
Bought by
Bidlack Mark A
Purchase Details
Closed on
Oct 21, 1999
Bought by
Schreiner Lynette M
Purchase Details
Closed on
Aug 4, 1998
Bought by
Smith Judi L
Create a Home Valuation Report for This Property
The Home Valuation Report is an in-depth analysis detailing your home's value as well as a comparison with similar homes in the area
Home Values in the Area
Average Home Value in this Area
Purchase History
| Date | Buyer | Sale Price | Title Company |
|---|---|---|---|
| Weir Peter H | $128,500 | Attorney | |
| Bidlack Mark A | $133,000 | None Available | |
| Bidlack Mark A | $133,000 | -- | |
| Schreiner Lynette M | $134,000 | -- | |
| Smith Judi L | $129,500 | -- |
Source: Public Records
Mortgage History
| Date | Status | Borrower | Loan Amount |
|---|---|---|---|
| Previous Owner | Weir Peter H | $128,500 | |
| Previous Owner | Bidlack Mark A | $119,000 |
Source: Public Records
Tax History Compared to Growth
Tax History
| Year | Tax Paid | Tax Assessment Tax Assessment Total Assessment is a certain percentage of the fair market value that is determined by local assessors to be the total taxable value of land and additions on the property. | Land | Improvement |
|---|---|---|---|---|
| 2024 | $2,232 | $67,390 | $11,960 | $55,430 |
| 2023 | $2,232 | $67,390 | $11,960 | $55,430 |
| 2022 | $1,968 | $51,850 | $9,570 | $42,280 |
| 2021 | $1,916 | $51,850 | $9,570 | $42,280 |
| 2020 | $1,924 | $52,230 | $9,570 | $42,660 |
| 2019 | $1,748 | $46,710 | $9,570 | $37,140 |
| 2018 | $1,726 | $46,710 | $9,570 | $37,140 |
| 2017 | $1,728 | $46,710 | $9,570 | $37,140 |
| 2016 | $1,801 | $50,490 | $9,570 | $40,920 |
| 2015 | $1,801 | $50,490 | $9,570 | $40,920 |
| 2014 | $1,833 | $50,490 | $9,570 | $40,920 |
| 2013 | $1,957 | $50,090 | $9,570 | $40,520 |
Source: Public Records
Map
Nearby Homes
- 1057 Maxine Ln
- 1008 Maplewood Dr
- 1236 E Ervin Rd
- 515 S Race St
- 529 S Tyler St
- 627 S Walnut St
- 914 E Crawford St
- 1060 1056 S Washington St
- 14162 Overholt Rd
- 1026 Elm St
- 222 S Harrison St
- 142 E Raymond St
- 133 Balyeat Ave
- 941 Elm St
- 1120 Park St
- 919 E Sycamore St
- 960 Glenn St
- 202 N Jefferson St
- 522 South Ave
- 214 N Jefferson St
- 1089 Maxine Ln
- 1195 Madison Blvd
- 1193 Madison Blvd
- 1096 Maxine Ln
- 1271 Madison Blvd
- 1081 Maxine Ln
- 1191 Madison Blvd
- 1088 Maxine Ln
- 1275 Madison Blvd
- 1295 Madison Blvd
- 1080 Maxine Ln
- 1073 Maxine Ln
- 1099 Madison Blvd
- 1063 Garfield St
- 1097 Mockingbird Ln
- 1089 Mockingbird Ln
- 1072 Maxine Ln
- 1279 Madison Blvd
- 1060 Bruns Ave
- 1081 Mockingbird Ln