Estimated Value: $344,000 - $609,000
4
Beds
5
Baths
3,440
Sq Ft
$134/Sq Ft
Est. Value
About This Home
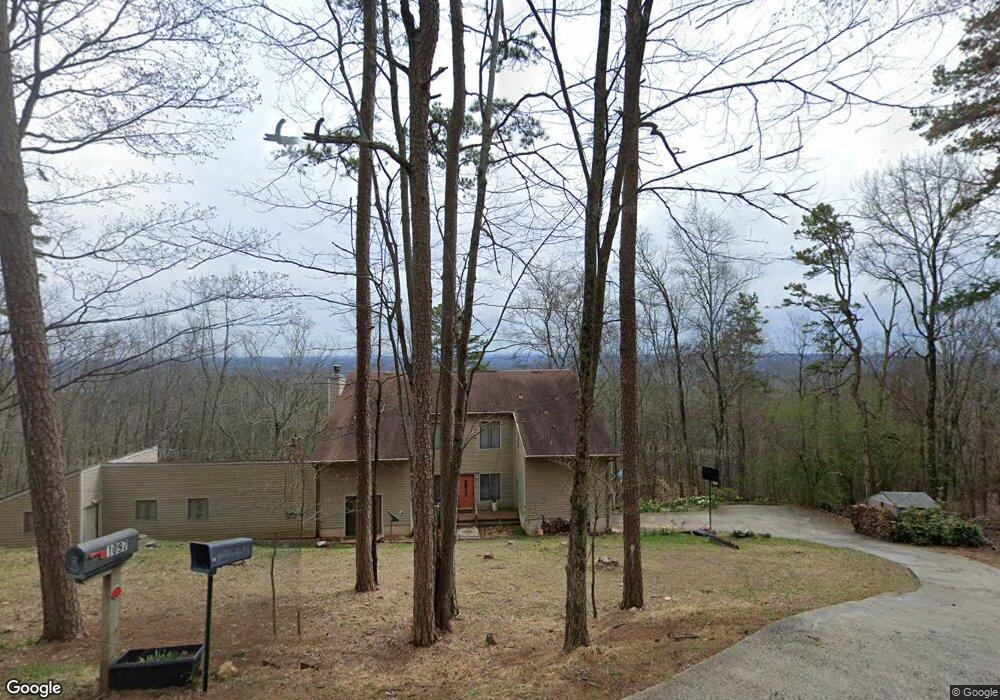
This home is located at 1097 Mount Alto Rd SW, Rome, GA 30165 and is currently estimated at $461,262, approximately $134 per square foot. 1097 Mount Alto Rd SW is a home located in Floyd County with nearby schools including Coosa Middle School and Coosa High School.
Ownership History
Date
Name
Owned For
Owner Type
Purchase Details
Closed on
May 31, 2016
Sold by
Le V Truong
Bought by
Le V Truong and Nguyen Thoan T
Current Estimated Value
Home Financials for this Owner
Home Financials are based on the most recent Mortgage that was taken out on this home.
Original Mortgage
$152,683
Outstanding Balance
$66,058
Interest Rate
2.75%
Mortgage Type
FHA
Estimated Equity
$395,204
Purchase Details
Closed on
Sep 8, 2010
Sold by
Reichel Sharon W
Bought by
Reichel Sharon W Revocable Liv
Purchase Details
Closed on
Apr 20, 2010
Sold by
Reichel Sharon W
Bought by
Reichel Sharon W
Purchase Details
Closed on
Mar 30, 1984
Sold by
Bodden Heath H and Bodden Luanne
Bought by
Reichel Charles E and Reichel Wife
Purchase Details
Closed on
May 20, 1977
Bought by
Bodden Heath H and Bodden Luanne
Create a Home Valuation Report for This Property
The Home Valuation Report is an in-depth analysis detailing your home's value as well as a comparison with similar homes in the area
Home Values in the Area
Average Home Value in this Area
Purchase History
| Date | Buyer | Sale Price | Title Company |
|---|---|---|---|
| Le V Truong | -- | -- | |
| Le V Truong | $154,000 | -- | |
| Reichel Sharon W Revocable Liv | -- | -- | |
| Reichel Sharon W | -- | -- | |
| Reichel Charles E | $80,000 | -- | |
| Bodden Heath H | $7,000 | -- |
Source: Public Records
Mortgage History
| Date | Status | Borrower | Loan Amount |
|---|---|---|---|
| Open | Le V Truong | $152,683 | |
| Closed | Le V Truong | $152,683 |
Source: Public Records
Tax History Compared to Growth
Tax History
| Year | Tax Paid | Tax Assessment Tax Assessment Total Assessment is a certain percentage of the fair market value that is determined by local assessors to be the total taxable value of land and additions on the property. | Land | Improvement |
|---|---|---|---|---|
| 2024 | $3,302 | $106,459 | $42,614 | $63,845 |
| 2023 | $3,046 | $101,654 | $38,740 | $62,914 |
| 2022 | $2,494 | $84,071 | $31,290 | $52,781 |
| 2021 | $2,307 | $76,447 | $28,408 | $48,039 |
| 2020 | $2,172 | $71,369 | $24,703 | $46,666 |
| 2019 | $1,991 | $66,303 | $24,703 | $41,600 |
| 2018 | $2,514 | $83,546 | $23,526 | $60,020 |
| 2017 | $1,857 | $84,996 | $21,784 | $63,212 |
| 2016 | $2,440 | $79,960 | $21,760 | $58,200 |
| 2015 | $3,332 | $99,320 | $28,280 | $71,040 |
| 2014 | $3,332 | $99,320 | $28,280 | $71,040 |
Source: Public Records
Map
Nearby Homes
- 0 Mt Alto Rd Sw Lot Unit WP001
- 186 Fairview Dr SW
- 16 Brandon Ln
- 30 Fairview Dr SW
- 31 Bentley Ln SW
- 31 Bentley Ln
- 0 Radio Springs Rd SW Unit 10587642
- 0 Radio Springs Rd SW Unit 10587644
- 0 Radio Springs Rd SW Unit 10587646
- 12 Lucas Ln SW
- 83 Manning Lake Rd SW
- 99 Janie Beth Dr SW
- 21 River Pine Dr SW
- 27 Stonebrook Dr SW
- 37 Mountain Chase Rd SW
- 11 Brow Rd SW
- 0 Hidden Ridge Dr Unit 10343694
- 0 Hidden Ridge Dr Unit 10343706
- 0 Hidden Ridge Dr Unit 10343701
- 0 Hidden Ridge Dr Unit 10343693
- 1097 Mt Alto Rd SW
- 1092 Mount Alto Rd SW
- 1092 Mount Alto Rd SW
- 1065 Mount Alto Rd SW
- 1070 Mount Alto Rd SW
- 1149 Mount Alto Rd SW
- 1168 Mount Alto Rd SW
- 1168 Mount Alto Rd SW
- 1168 Mount Alto Rd SW
- 1168 Mount Alto Rd SW
- 1050 Mount Alto Rd SW
- 1001 Mount Alto Rd SW
- 1201 Mount Alto Rd SW
- 1201 Mount Alto Rd SW
- 1220 Mount Alto Rd SW
- 1220 Mount Alto Rd SW
- 1220 Mt Alto Rd SW
- 1221 Mount Alto Rd SW
- 1221 Mt Alto Rd SW
- 1225 Mt Alto Rd SW