Estimated Value: $232,069 - $254,000
3
Beds
2
Baths
1,180
Sq Ft
$204/Sq Ft
Est. Value
About This Home
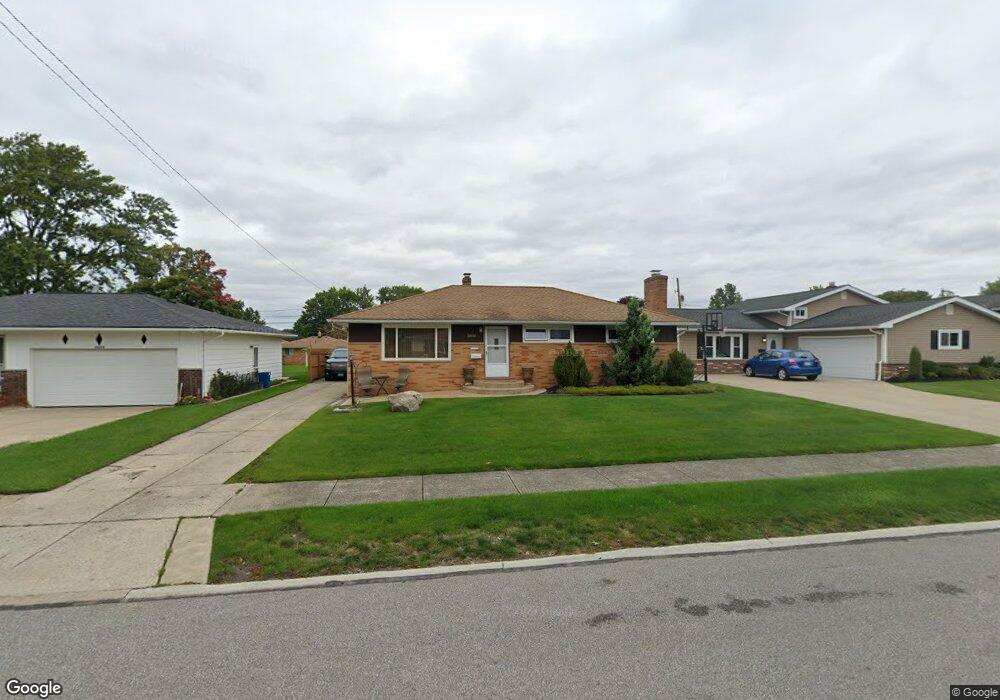
This home is located at 10970 Gross Dr, Parma, OH 44130 and is currently estimated at $240,517, approximately $203 per square foot. 10970 Gross Dr is a home located in Cuyahoga County with nearby schools including Pleasant Valley Elementary School, Greenbriar Middle School, and Valley Forge High School.
Ownership History
Date
Name
Owned For
Owner Type
Purchase Details
Closed on
Jun 8, 2011
Sold by
Shepard Rebecca S and Baker Donna J
Bought by
Florio Vito J
Current Estimated Value
Home Financials for this Owner
Home Financials are based on the most recent Mortgage that was taken out on this home.
Original Mortgage
$79,790
Outstanding Balance
$54,669
Interest Rate
4.5%
Mortgage Type
FHA
Estimated Equity
$185,848
Purchase Details
Closed on
Jun 7, 2007
Sold by
Shepard Rebecca S and Baker Donna J
Bought by
Shepard Rebecca S and Baker Donna J
Purchase Details
Closed on
Dec 26, 2002
Sold by
Dennison John
Bought by
Shepard Rebecca S and Baker Donna J
Home Financials for this Owner
Home Financials are based on the most recent Mortgage that was taken out on this home.
Original Mortgage
$100,000
Interest Rate
6.01%
Purchase Details
Closed on
Aug 1, 1978
Sold by
Dennison Paul E and Dennison Helen
Bought by
Dennison Paul E
Purchase Details
Closed on
Jan 1, 1975
Bought by
Dennison Paul E and Dennison Helen
Create a Home Valuation Report for This Property
The Home Valuation Report is an in-depth analysis detailing your home's value as well as a comparison with similar homes in the area
Home Values in the Area
Average Home Value in this Area
Purchase History
| Date | Buyer | Sale Price | Title Company |
|---|---|---|---|
| Florio Vito J | $103,000 | Suntrust Title Agency | |
| Shepard Rebecca S | -- | None Available | |
| Shepard Rebecca S | $130,000 | Midland Title Security Inc | |
| Dennison Paul E | -- | -- | |
| Dennison Paul E | -- | -- |
Source: Public Records
Mortgage History
| Date | Status | Borrower | Loan Amount |
|---|---|---|---|
| Open | Florio Vito J | $79,790 | |
| Previous Owner | Shepard Rebecca S | $100,000 |
Source: Public Records
Tax History Compared to Growth
Tax History
| Year | Tax Paid | Tax Assessment Tax Assessment Total Assessment is a certain percentage of the fair market value that is determined by local assessors to be the total taxable value of land and additions on the property. | Land | Improvement |
|---|---|---|---|---|
| 2024 | $4,145 | $68,110 | $13,300 | $54,810 |
| 2023 | $3,623 | $51,140 | $10,820 | $40,320 |
| 2022 | $3,592 | $51,140 | $10,820 | $40,320 |
| 2021 | $3,695 | $51,140 | $10,820 | $40,320 |
| 2020 | $3,504 | $42,980 | $9,100 | $33,880 |
| 2019 | $3,365 | $122,800 | $26,000 | $96,800 |
| 2018 | $3,231 | $42,980 | $9,100 | $33,880 |
| 2017 | $3,244 | $38,400 | $7,910 | $30,490 |
| 2016 | $3,223 | $38,400 | $7,910 | $30,490 |
| 2015 | $3,065 | $38,400 | $7,910 | $30,490 |
| 2014 | $3,065 | $38,400 | $7,910 | $30,490 |
Source: Public Records
Map
Nearby Homes
- 11000 W Sprague Rd
- 11339 Gordon Dr
- 8414 York Rd
- 9581 Tilby Rd
- 9530 Tilby Rd
- 7517 Zona Ln
- 8960 Wildwood Dr
- 12220 Zona Ln
- 9841 Beechwood Dr
- 9912 Lynn Dr
- 8981 Edgewood Dr
- 9901 Beechwood Dr
- 9616 W Pleasant Valley Rd
- 7706 Wake Robin Dr
- 10260 Terrace Ct
- 0 Tilby Rd
- 10821 Gregory Ln
- 8501 Pin Oak Dr
- 12631 Pinebrook Dr
- 7547 N Linden Ln
- 10940 Gross Dr
- 10990 Gross Dr
- 10920 Gross Dr
- 11020 Gross Dr
- 10965 Johnson Dr
- 10935 Johnson Dr
- 10993 Johnson Dr
- 10900 Gross Dr
- 11030 Gross Dr
- 10915 Johnson Dr
- 11005 Johnson Dr
- 10965 Gross Dr
- 10985 Gross Dr
- 10935 Gross Dr
- 10895 Johnson Dr
- 11025 Johnson Dr
- 10915 Gross Dr
- 11040 Gross Dr
- 10870 Gross Dr
- 11025 Gross Dr