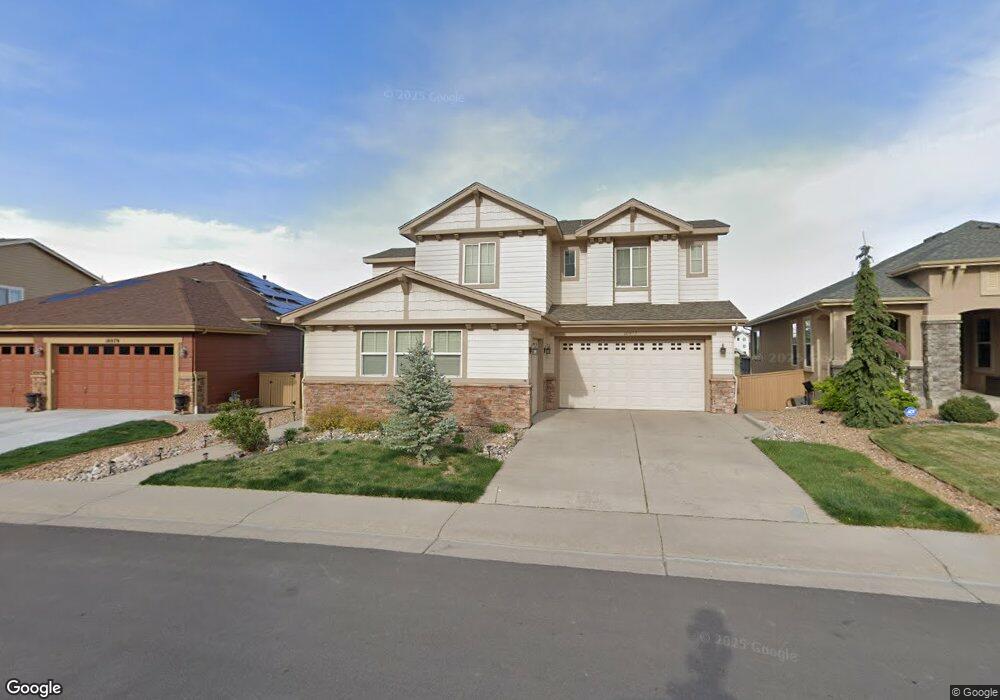
10977 Glengate Cir Highlands Ranch, CO 80130
Southridge NeighborhoodEstimated Value: $1,033,657 - $1,207,000
4
Beds
4
Baths
5,017
Sq Ft
$218/Sq Ft
Est. Value
About This Home
This home is located at 10977 Glengate Cir, Highlands Ranch, CO 80130 and is currently estimated at $1,094,914, approximately $218 per square foot. 10977 Glengate Cir is a home located in Douglas County with nearby schools including Wildcat Mountain Elementary School, Rocky Heights Middle School, and Rock Canyon High School.
Ownership History
Date
Name
Owned For
Owner Type
Purchase Details
Closed on
Oct 2, 2015
Sold by
Clark Staci D
Bought by
Raizada Shashank and Khan Tabassum
Current Estimated Value
Home Financials for this Owner
Home Financials are based on the most recent Mortgage that was taken out on this home.
Original Mortgage
$400,000
Outstanding Balance
$162,863
Interest Rate
3.97%
Mortgage Type
New Conventional
Estimated Equity
$932,051
Purchase Details
Closed on
Dec 3, 2012
Sold by
Clark Staci D
Bought by
Clark Staci D
Purchase Details
Closed on
Jan 30, 2006
Sold by
Shea Homes Lp
Bought by
Clark Christopher M and Clark Staci D
Home Financials for this Owner
Home Financials are based on the most recent Mortgage that was taken out on this home.
Original Mortgage
$471,450
Interest Rate
5.75%
Mortgage Type
Fannie Mae Freddie Mac
Create a Home Valuation Report for This Property
The Home Valuation Report is an in-depth analysis detailing your home's value as well as a comparison with similar homes in the area
Home Values in the Area
Average Home Value in this Area
Purchase History
| Date | Buyer | Sale Price | Title Company |
|---|---|---|---|
| Raizada Shashank | $620,000 | Prestige Title & Escrow | |
| Clark Staci D | -- | None Available | |
| Clark Christopher M | $589,372 | Fahtco |
Source: Public Records
Mortgage History
| Date | Status | Borrower | Loan Amount |
|---|---|---|---|
| Open | Raizada Shashank | $400,000 | |
| Previous Owner | Clark Christopher M | $471,450 |
Source: Public Records
Tax History Compared to Growth
Tax History
| Year | Tax Paid | Tax Assessment Tax Assessment Total Assessment is a certain percentage of the fair market value that is determined by local assessors to be the total taxable value of land and additions on the property. | Land | Improvement |
|---|---|---|---|---|
| 2024 | $7,035 | $78,320 | $12,680 | $65,640 |
| 2023 | $7,022 | $78,320 | $12,680 | $65,640 |
| 2022 | $4,722 | $51,690 | $9,260 | $42,430 |
| 2021 | $4,911 | $51,690 | $9,260 | $42,430 |
| 2020 | $4,653 | $50,170 | $8,970 | $41,200 |
| 2019 | $4,670 | $50,170 | $8,970 | $41,200 |
| 2018 | $4,555 | $48,200 | $8,470 | $39,730 |
| 2017 | $4,148 | $48,200 | $8,470 | $39,730 |
| 2016 | $4,323 | $49,300 | $8,050 | $41,250 |
| 2015 | $4,416 | $49,300 | $8,050 | $41,250 |
| 2014 | $2,119 | $43,700 | $7,960 | $35,740 |
Source: Public Records
Map
Nearby Homes
- 4821 Bluegate Dr
- 5300 Fullerton Ln
- 11036 Glengate Cir
- 4965 Huntwick Place
- 10881 Glengate Cir
- 11074 Grayledge Cir
- 10754 Towerbridge Cir
- 10660 Jewelberry Cir
- 10645 Cedarcrest Cir
- 10896 Valleybrook Cir
- 10497 Wagon Box Cir
- 6042 Sima Cir
- 10547 Laurelglen Cir
- 10653 Briarglen Cir
- 5639 Jaguar Way
- 10832 Hickory Ridge Ln
- 4656 Ketchwood Cir
- 10557 Eby Cir
- 10994 Shadowbrook Cir
- 5001 Laurelglen Ln
- 10973 Glengate Cir
- 10979 Glengate Cir
- 10983 Glengate Cir
- 10969 Glengate Cir
- 10976 Glengate Cir
- 10980 Glengate Cir
- 10987 Glengate Cir
- 10967 Glengate Cir
- 10970 Glengate Cir
- 10986 Glengate Cir
- 10966 Glengate Cir
- 10993 Glengate Cir
- 10963 Glengate Cir
- 10990 Glengate Cir
- 10960 Glengate Cir
- 4884 Bluegate Dr
- 4878 Bluegate Dr
- 10995 Glengate Cir
- 10959 Glengate Cir
- 4872 Bluegate Dr