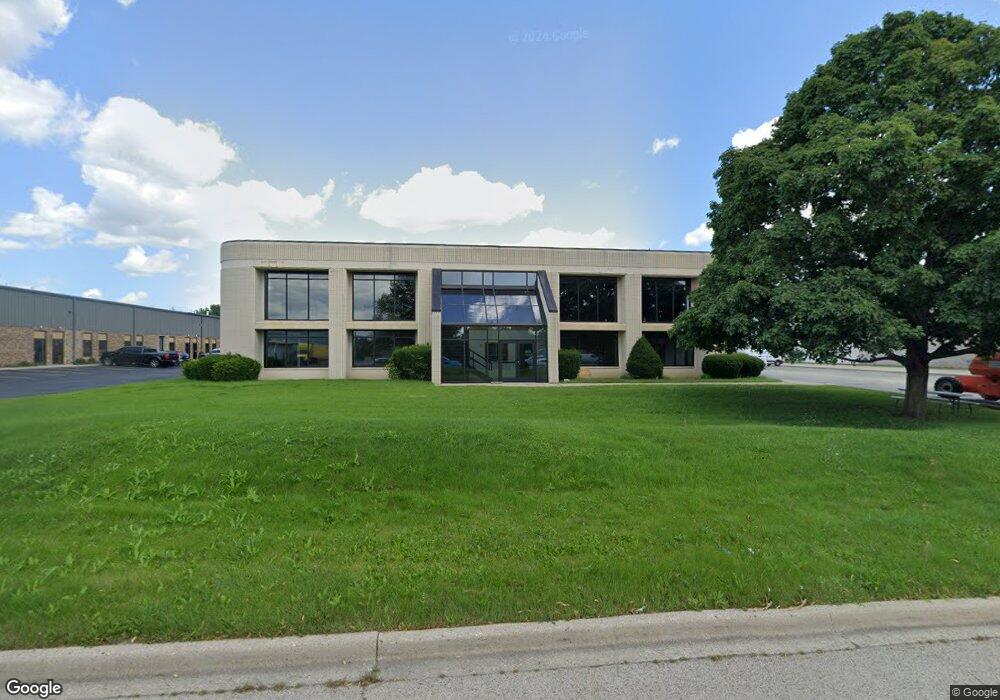
1098 Brown St Wauconda, IL 60084
--
Bed
--
Bath
--
Sq Ft
1.87
Acres
About This Home
This home is located at 1098 Brown St, Wauconda, IL 60084. 1098 Brown St is a home located in Lake County with nearby schools including Wauconda Grade School, Wauconda Middle School, and Wauconda High School.
Ownership History
Date
Name
Owned For
Owner Type
Purchase Details
Closed on
May 6, 2024
Sold by
Morris Mailing Inc and Michael Murray Morris Living Trust
Bought by
Mjkil Llc
Purchase Details
Closed on
Mar 5, 2024
Sold by
Morris Mailing Inc
Bought by
Michael Murray Morris Living Trust
Purchase Details
Closed on
Mar 17, 2015
Sold by
Clover Investment Corporation
Bought by
Morris Mailing Inc
Home Financials for this Owner
Home Financials are based on the most recent Mortgage that was taken out on this home.
Original Mortgage
$1,050,000
Interest Rate
3.56%
Mortgage Type
Commercial
Purchase Details
Closed on
Aug 12, 2004
Sold by
Markham James P
Bought by
Clover Investment Corp
Home Financials for this Owner
Home Financials are based on the most recent Mortgage that was taken out on this home.
Original Mortgage
$1,376,709
Interest Rate
5.93%
Mortgage Type
Construction
Create a Home Valuation Report for This Property
The Home Valuation Report is an in-depth analysis detailing your home's value as well as a comparison with similar homes in the area
Home Values in the Area
Average Home Value in this Area
Purchase History
| Date | Buyer | Sale Price | Title Company |
|---|---|---|---|
| Mjkil Llc | $2,200,000 | Greater Illinois Title | |
| Michael Murray Morris Living Trust | -- | None Listed On Document | |
| Morris Mailing Inc | $1,050,000 | Greater Illinois Title Co | |
| Clover Investment Corp | $828,000 | Ticor |
Source: Public Records
Mortgage History
| Date | Status | Borrower | Loan Amount |
|---|---|---|---|
| Previous Owner | Morris Mailing Inc | $1,050,000 | |
| Previous Owner | Clover Investment Corp | $1,376,709 |
Source: Public Records
Tax History Compared to Growth
Tax History
| Year | Tax Paid | Tax Assessment Tax Assessment Total Assessment is a certain percentage of the fair market value that is determined by local assessors to be the total taxable value of land and additions on the property. | Land | Improvement |
|---|---|---|---|---|
| 2024 | $60,631 | $651,541 | $86,633 | $564,908 |
| 2023 | $60,631 | $595,558 | $79,189 | $516,369 |
| 2022 | $60,631 | $555,661 | $73,884 | $481,777 |
| 2021 | $48,036 | $525,051 | $69,814 | $455,237 |
| 2020 | $46,345 | $425,724 | $66,540 | $359,184 |
| 2019 | $42,818 | $402,347 | $62,886 | $339,461 |
| 2018 | $46,850 | $407,275 | $63,657 | $343,618 |
| 2017 | $46,831 | $402,565 | $62,921 | $339,644 |
| 2016 | $44,183 | $381,217 | $59,584 | $321,633 |
| 2015 | $41,848 | $480,125 | $54,699 | $425,426 |
| 2014 | $61,858 | $520,414 | $50,973 | $469,441 |
| 2012 | $59,858 | $529,791 | $51,891 | $477,900 |
Source: Public Records
Map
Nearby Homes
- 235 Regency Ct Unit B
- 240 Regency Ct
- 26241 W Bonner Rd
- 225 Regency Ct Unit A
- 136 Parkview Dr Unit 5136
- 845 Osage Terrace
- 26049 N Il Route 59
- 225 Larkdale Row
- 28177 N Garland Rd
- 450 N Main St Unit S307A
- 450 N Main St Unit S208A
- 453 Willow Rd
- 28855 N Garland Rd
- 311 Brown St
- 136 Hubbard Ct
- 29564 N Garland Rd
- 27514 N Forest Garden Rd
- 0 Bonner Rd
- 28722 N Madison Ave
- 125 E Mill St Unit D103
- 1000 Brown St Unit 106
- 1000 Brown St Unit 103
- 1000 Brown St Unit 101
- 1000 Brown St Unit 112-114
- 1000 Brown St Unit 114
- 1000 Brown St Unit 209
- 1000 Brown St Unit 204
- 1000 Brown St Unit 312
- 1000 Brown St Unit 212
- 1000 Brown St Unit 214
- 1000 Brown St Unit 111
- 1000 Brown St Unit 30
- 1000 Brown St Unit 203
- 1000 Brown St Unit 210
- 1000 Brown St Unit 305
- 1000 Brown St Unit 108-110
- 1000 Brown St Unit 109-110
- 1000 Brown St Unit 209
- 1000 Brown St Unit 306
- 1000 Brown St Unit 206