Estimated Value: $463,000 - $501,000
2
Beds
1
Bath
1,640
Sq Ft
$291/Sq Ft
Est. Value
About This Home
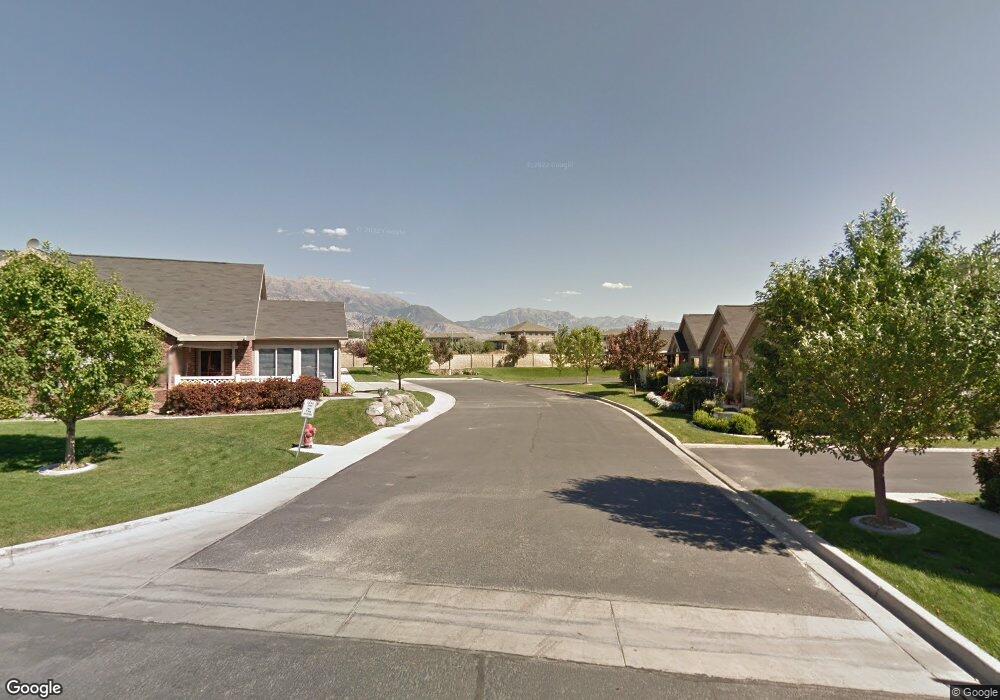
This home is located at 1098 E 310 N Unit I3, Lehi, UT 84043 and is currently estimated at $477,159, approximately $290 per square foot. 1098 E 310 N Unit I3 is a home located in Utah County with nearby schools including Sego Lily Elementary School, Lehi Junior High School, and Skyridge High School.
Ownership History
Date
Name
Owned For
Owner Type
Purchase Details
Closed on
Jul 9, 2022
Sold by
Gamer Family Trust
Bought by
Gamer Family Trust
Current Estimated Value
Purchase Details
Closed on
Mar 21, 2022
Sold by
Fred Anderson
Bought by
Cynthia L Repass Trust
Purchase Details
Closed on
Feb 10, 2022
Sold by
Fred Anderson
Bought by
Cynthia L Repass Trust
Purchase Details
Closed on
Nov 18, 2011
Sold by
Garner Ronald B and Garner Coreen A
Bought by
Garner Ronald B and Garner Coreen A
Create a Home Valuation Report for This Property
The Home Valuation Report is an in-depth analysis detailing your home's value as well as a comparison with similar homes in the area
Home Values in the Area
Average Home Value in this Area
Purchase History
| Date | Buyer | Sale Price | Title Company |
|---|---|---|---|
| Gamer Family Trust | -- | Truly Title | |
| Cynthia L Repass Trust | -- | Access Title | |
| Cynthia L Repass Trust | -- | Access Title | |
| Garner Ronald B | -- | None Available |
Source: Public Records
Tax History
| Year | Tax Paid | Tax Assessment Tax Assessment Total Assessment is a certain percentage of the fair market value that is determined by local assessors to be the total taxable value of land and additions on the property. | Land | Improvement |
|---|---|---|---|---|
| 2025 | $2,019 | $242,275 | -- | -- |
| 2024 | $2,019 | $236,225 | $0 | $0 |
| 2023 | $1,812 | $230,285 | $0 | $0 |
| 2022 | $1,894 | $233,310 | $0 | $0 |
| 2021 | $1,712 | $318,900 | $47,800 | $271,100 |
| 2020 | $1,677 | $308,700 | $46,300 | $262,400 |
| 2019 | $1,458 | $279,100 | $41,900 | $237,200 |
| 2018 | $1,366 | $247,100 | $37,100 | $210,000 |
| 2017 | $1,413 | $135,905 | $0 | $0 |
| 2016 | $1,418 | $126,500 | $0 | $0 |
| 2015 | $1,493 | $126,500 | $0 | $0 |
| 2014 | $1,313 | $110,550 | $0 | $0 |
Source: Public Records
Map
Nearby Homes
- 414 N 1322 E
- 499 N 1520 E
- 484 N 950 W Unit 7
- 832 N Somerset Aly
- 807 N Somerset Aly
- 595 S 600 E
- 890 N Whipple Dr
- 1175 E 900 N
- 428 E 500 N
- 893 N 1580 E
- 509 E 300 S
- 822 N 860 W Unit 317
- 822 W 800 St N Unit LOT319
- 1117 N Cedar Hollow Blvd
- 777 W State Rd
- 4007 W 1000 N
- 3947 W 1000 N Unit 439
- 3971 W 1000 N Unit 441
- 3959 W 1000 N
- 3995 W 1000 N
- 1098 E 310 N Unit 14
- 1098 E 310 N Unit I1
- 1098 E 310 N Unit I2
- 1066 E 310 N Unit J4
- 1066 E 310 N Unit J1
- 1066 E 310 N Unit J3
- 1066 E 310 N Unit J2
- 1066 E 310 N Unit 3
- 1066 E 310 N Unit J
- 1024 E State St
- 1036 E 310 N Unit K4
- 1036 E 310 N Unit 3
- 314 N 1100 E
- 314 N 1100 E Unit H3
- 314 N 1100 E Unit 3
- 336 N 1030 E Unit T-3
- 336 N 1030 E Unit T1
- 336 N 1030 E Unit 2
- 336 N 1030 E Unit T4
- 344 N 1100 E Unit G1
Your Personal Tour Guide
Ask me questions while you tour the home.