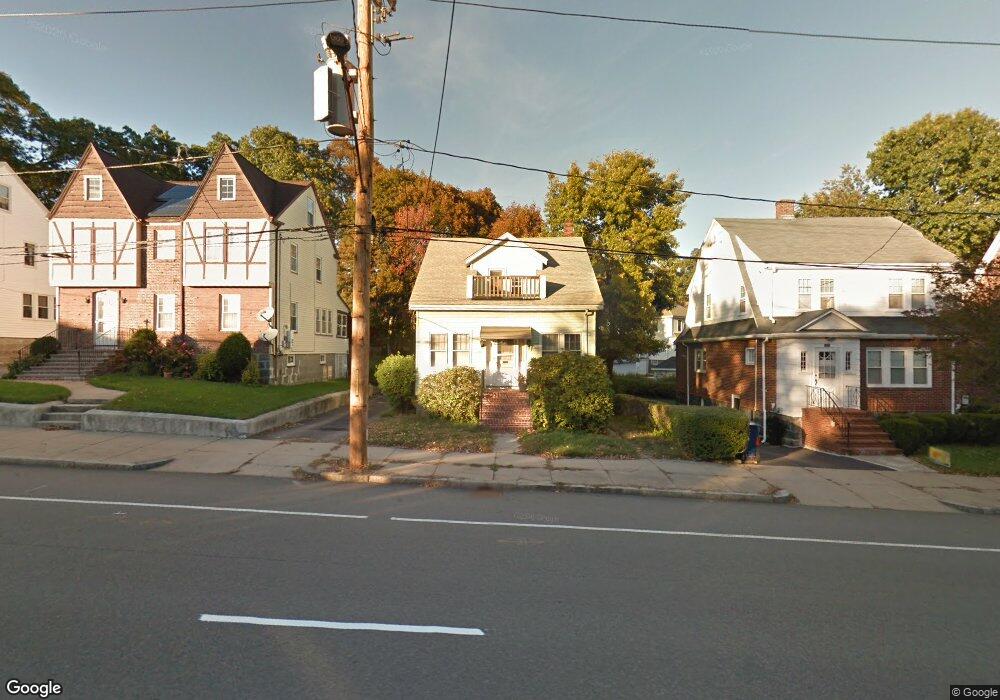
1098 Morton St Mattapan, MA 02126
West Codman Hill-West Lowe NeighborhoodEstimated Value: $569,000 - $621,266
2
Beds
1
Bath
1,128
Sq Ft
$533/Sq Ft
Est. Value
About This Home
This home is located at 1098 Morton St, Mattapan, MA 02126 and is currently estimated at $601,567, approximately $533 per square foot. 1098 Morton St is a home located in Suffolk County with nearby schools including Conservatory Lab Upper School and Saint John Paul II Catholic Academy.
Ownership History
Date
Name
Owned For
Owner Type
Purchase Details
Closed on
Feb 12, 2010
Sold by
Myers Margie R and Myers Richard A
Bought by
Myers Maxine L
Current Estimated Value
Purchase Details
Closed on
Jun 24, 1987
Sold by
Martin Thomas E
Bought by
Myers Richard A
Home Financials for this Owner
Home Financials are based on the most recent Mortgage that was taken out on this home.
Original Mortgage
$82,500
Interest Rate
10.5%
Mortgage Type
Purchase Money Mortgage
Create a Home Valuation Report for This Property
The Home Valuation Report is an in-depth analysis detailing your home's value as well as a comparison with similar homes in the area
Home Values in the Area
Average Home Value in this Area
Purchase History
| Date | Buyer | Sale Price | Title Company |
|---|---|---|---|
| Myers Maxine L | -- | -- | |
| Myers Richard A | $125,000 | -- |
Source: Public Records
Mortgage History
| Date | Status | Borrower | Loan Amount |
|---|---|---|---|
| Previous Owner | Myers Richard A | $82,500 |
Source: Public Records
Tax History Compared to Growth
Tax History
| Year | Tax Paid | Tax Assessment Tax Assessment Total Assessment is a certain percentage of the fair market value that is determined by local assessors to be the total taxable value of land and additions on the property. | Land | Improvement |
|---|---|---|---|---|
| 2025 | $6,207 | $536,000 | $193,800 | $342,200 |
| 2024 | $5,478 | $502,600 | $188,400 | $314,200 |
| 2023 | $5,192 | $483,400 | $181,200 | $302,200 |
| 2022 | $4,870 | $447,600 | $167,800 | $279,800 |
| 2021 | $4,601 | $431,200 | $167,800 | $263,400 |
| 2020 | $4,186 | $396,400 | $170,800 | $225,600 |
| 2019 | $3,869 | $367,100 | $131,600 | $235,500 |
| 2018 | $3,665 | $349,700 | $131,600 | $218,100 |
| 2017 | $3,493 | $329,800 | $131,600 | $198,200 |
| 2016 | $3,359 | $305,400 | $131,600 | $173,800 |
| 2015 | $3,432 | $283,400 | $115,000 | $168,400 |
| 2014 | $3,329 | $264,600 | $115,000 | $149,600 |
Source: Public Records
Map
Nearby Homes
- 36 Oakridge St
- 23 Maryknoll St
- 84-86 Codman Hill Ave
- 30 Pleasant Hill Ave Unit 32
- 67 Idaho St
- 147 Fairmount St
- 56 Fairmount St Unit 2
- 32-32R Temple St
- 183 Fuller St Unit 1
- 72 Mora St
- 8-14R Temple St
- 30 Glenhill Rd
- 157-159 Fuller St
- 81 Mora St
- 10-12 Stow Rd
- 64 Stockton St
- 2 Ogden St Unit 1
- 44 Mora St
- 124 Selden St
- 44 Evans St