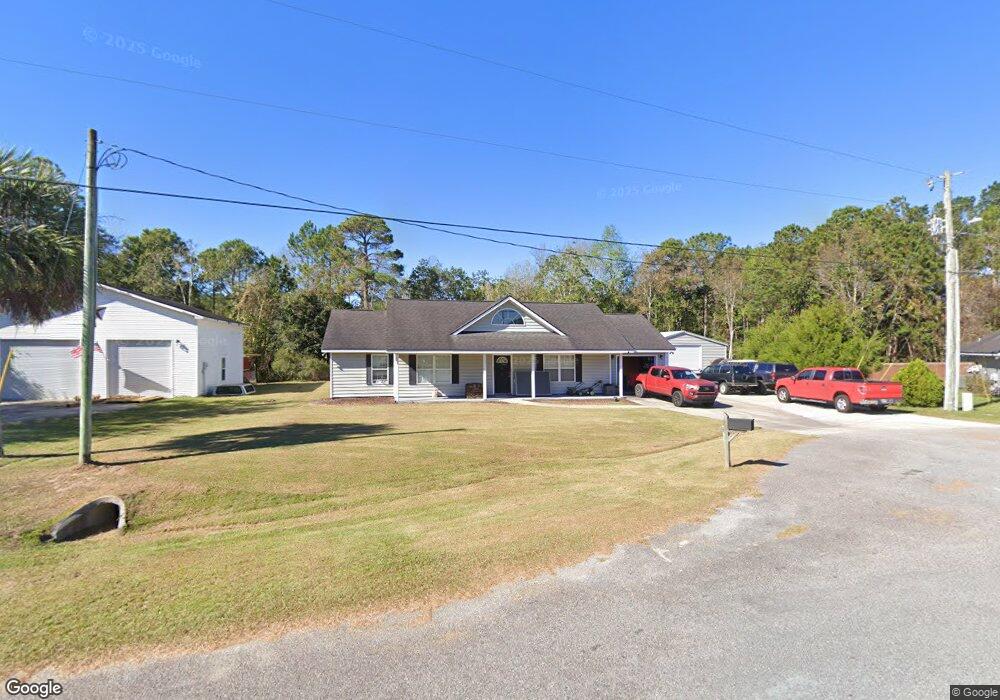
1098 Nautical Dr SE Townsend, GA 31331
Estimated Value: $253,105 - $275,000
3
Beds
1
Bath
1,385
Sq Ft
$191/Sq Ft
Est. Value
About This Home
This home is located at 1098 Nautical Dr SE, Townsend, GA 31331 and is currently estimated at $264,026, approximately $190 per square foot. 1098 Nautical Dr SE is a home with nearby schools including Todd Grant Elementary School, McIntosh County Middle School, and McIntosh County Academy.
Ownership History
Date
Name
Owned For
Owner Type
Purchase Details
Closed on
May 19, 2008
Sold by
Fhlm Corp
Bought by
Taylor Cary
Current Estimated Value
Home Financials for this Owner
Home Financials are based on the most recent Mortgage that was taken out on this home.
Original Mortgage
$114,240
Outstanding Balance
$71,302
Interest Rate
5.86%
Mortgage Type
New Conventional
Estimated Equity
$192,724
Purchase Details
Closed on
Sep 19, 2007
Sold by
Monroe Darrell G and Monroe Karen D
Bought by
Taylor Bean & Whitaker Mortgage Corp
Purchase Details
Closed on
Sep 4, 2007
Sold by
Taylor Bean & Whitaker Mtg
Bought by
Federal Home Loan Mortgage Corporation
Purchase Details
Closed on
Jul 19, 2006
Sold by
Komons Alex H
Bought by
Monroe Darrel G and Monroe Karen D
Home Financials for this Owner
Home Financials are based on the most recent Mortgage that was taken out on this home.
Original Mortgage
$107,200
Interest Rate
6.68%
Mortgage Type
New Conventional
Purchase Details
Closed on
Aug 26, 2005
Sold by
Colonial Coast Development Co
Bought by
Komons Alex H
Home Financials for this Owner
Home Financials are based on the most recent Mortgage that was taken out on this home.
Original Mortgage
$102,163
Interest Rate
5.61%
Mortgage Type
New Conventional
Purchase Details
Closed on
Apr 25, 2005
Sold by
Coastal Pine Forest Llc
Bought by
Colonial Coast Dev Co
Create a Home Valuation Report for This Property
The Home Valuation Report is an in-depth analysis detailing your home's value as well as a comparison with similar homes in the area
Purchase History
| Date | Buyer | Sale Price | Title Company |
|---|---|---|---|
| Taylor Cary | $112,000 | -- | |
| Taylor Bean & Whitaker Mortgage Corp | -- | -- | |
| Federal Home Loan Mortgage Corporation | $111,844 | -- | |
| Taylor Bean & Whitaker Mtg Cor | $111,844 | -- | |
| Monroe Darrel G | $134,000 | -- | |
| Komons Alex H | $113,500 | -- | |
| Colonial Coast Dev Co | $208,200 | -- |
Source: Public Records
Mortgage History
| Date | Status | Borrower | Loan Amount |
|---|---|---|---|
| Open | Taylor Cary | $114,240 | |
| Previous Owner | Monroe Darrel G | $107,200 | |
| Previous Owner | Monroe Darrel G | $26,800 | |
| Previous Owner | Komons Alex H | $102,163 | |
| Previous Owner | Komons Alex H | $11,351 |
Source: Public Records
Tax History Compared to Growth
Tax History
| Year | Tax Paid | Tax Assessment Tax Assessment Total Assessment is a certain percentage of the fair market value that is determined by local assessors to be the total taxable value of land and additions on the property. | Land | Improvement |
|---|---|---|---|---|
| 2024 | $2,520 | $91,120 | $5,000 | $86,120 |
| 2023 | $2,445 | $82,360 | $5,000 | $77,360 |
| 2022 | $2,090 | $69,600 | $5,000 | $64,600 |
| 2021 | $1,409 | $53,040 | $5,000 | $48,040 |
| 2020 | $1,531 | $48,960 | $5,000 | $43,960 |
| 2019 | $1,517 | $51,360 | $5,000 | $46,360 |
| 2018 | $1,284 | $48,320 | $6,000 | $42,320 |
| 2017 | $1,173 | $39,200 | $6,000 | $33,200 |
| 2016 | $1,047 | $33,680 | $6,000 | $27,680 |
| 2015 | $1,009 | $33,062 | $4,000 | $29,063 |
| 2014 | $1,010 | $33,063 | $4,000 | $29,063 |
Source: Public Records
Map
Nearby Homes
- PRICE IMPROVEMENT Smith Rd SE
- 1441 Halyard Way SE
- 1215 Tidal Dr SE
- 1155 Merchant Ln SE
- 5096 Smith Rd
- 1247 Sapelo Cir SE
- 156 AC Us Hwy 17
- 1155 Sapelo Cir SE
- 1563 Sapelo Cir SE
- 18 Doboy Ct
- 1284 Jones Way SE
- 1264 Jones Way SE
- 0 Highway 99 Unit 22514247
- 1474 Mcintosh Trail SE
- 0 Crow Trail SE Unit 1654392
- Lot 21 Sutherland Bluff Dr NE
- LOT A Ga Highway 99
- 5554 Ga Highway 99
- Lot 8 Hudson Creek Dr SE
- 1334 Emma Ln SE
- 1094 Nautical Dr SE
- 1130 Nautical Dr SE
- 1088 Nautical Dr SE
- 1088 Nautical Dr SE Unit 37
- 1081 Nautical Dr SE
- 1143 Nautical Dr SE
- 1058 Nautical Dr SE
- 1125 McClow Ln SE
- 1143 McClow Ln SE
- 1022 Coastal Ln SE
- 1103 McClow Ln SE
- 1171 Nautical Dr SE
- 1163 McClow Ln SE
- 1183 McClow Ln SE
- 1025 Nautical Dr SE
- 44 McClow Ln SE
- 1034 Nautical Dr SE
- 1070 Coastal Ln SE
- 1065 McClow Ln SE
- 4262 Smith Rd SE