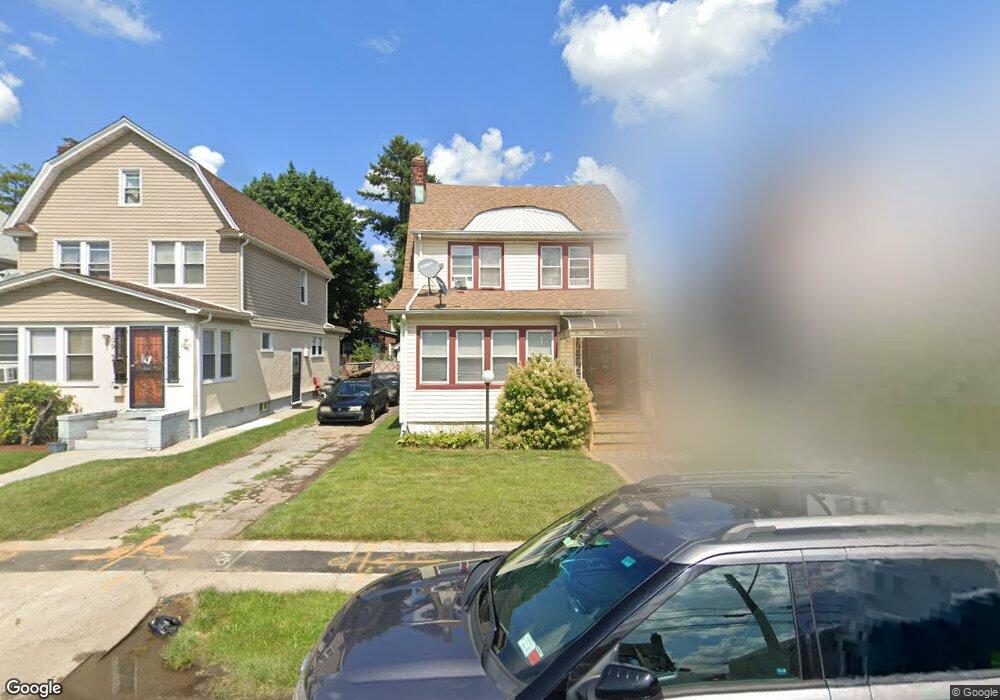
10981 200th St Saint Albans, NY 11412
Hollis NeighborhoodEstimated Value: $734,000 - $853,000
--
Bed
--
Bath
1,916
Sq Ft
$418/Sq Ft
Est. Value
About This Home
This home is located at 10981 200th St, Saint Albans, NY 11412 and is currently estimated at $801,129, approximately $418 per square foot. 10981 200th St is a home located in Queens County with nearby schools including P.S. 134 Langston Hughes School, I.S. 192 The Linden, and Wellspring Elementary & Middle.
Ownership History
Date
Name
Owned For
Owner Type
Purchase Details
Closed on
Dec 9, 2019
Sold by
Powell Dianne
Bought by
Reuben Candace A
Current Estimated Value
Home Financials for this Owner
Home Financials are based on the most recent Mortgage that was taken out on this home.
Original Mortgage
$554,766
Outstanding Balance
$489,106
Interest Rate
3.6%
Mortgage Type
New Conventional
Estimated Equity
$312,023
Purchase Details
Closed on
Sep 20, 2019
Sold by
Powell Blandford B and Powell Dianne
Bought by
Rowe Dianne
Purchase Details
Closed on
Feb 8, 2007
Sold by
Powell Blandford B
Bought by
Powell Blandford B and Powell Dianne
Purchase Details
Closed on
Sep 30, 2004
Sold by
Mcintosh Rayon and Powell Blandford B
Bought by
Powell Blandford B
Purchase Details
Closed on
Aug 24, 1998
Sold by
Ali Abdul Malik
Bought by
Powell Blandford B and Mcintosh Rayon
Create a Home Valuation Report for This Property
The Home Valuation Report is an in-depth analysis detailing your home's value as well as a comparison with similar homes in the area
Home Values in the Area
Average Home Value in this Area
Purchase History
| Date | Buyer | Sale Price | Title Company |
|---|---|---|---|
| Reuben Candace A | $565,000 | -- | |
| Reuben Candace A | $565,000 | -- | |
| Rowe Dianne | -- | -- | |
| Rowe Dianne | -- | -- | |
| Powell Blandford B | -- | -- | |
| Powell Blandford B | -- | -- | |
| Powell Blandford B | -- | -- | |
| Powell Blandford B | -- | -- | |
| Powell Blandford B | $159,000 | Trw Title Insurance | |
| Powell Blandford B | $159,000 | Trw Title Insurance |
Source: Public Records
Mortgage History
| Date | Status | Borrower | Loan Amount |
|---|---|---|---|
| Open | Reuben Candace A | $554,766 | |
| Closed | Reuben Candace A | $554,766 | |
| Closed | Powell Blandford B | $0 |
Source: Public Records
Tax History Compared to Growth
Tax History
| Year | Tax Paid | Tax Assessment Tax Assessment Total Assessment is a certain percentage of the fair market value that is determined by local assessors to be the total taxable value of land and additions on the property. | Land | Improvement |
|---|---|---|---|---|
| 2025 | $6,468 | $32,724 | $9,102 | $23,622 |
| 2024 | $6,468 | $32,203 | $10,182 | $22,021 |
| 2023 | $6,102 | $30,382 | $8,550 | $21,832 |
| 2022 | $5,722 | $38,280 | $12,900 | $25,380 |
| 2021 | $5,891 | $36,420 | $12,900 | $23,520 |
| 2020 | $5,772 | $31,560 | $12,900 | $18,660 |
| 2019 | $5,614 | $32,040 | $12,900 | $19,140 |
| 2018 | $5,161 | $25,318 | $11,177 | $14,141 |
| 2017 | $4,869 | $23,886 | $11,164 | $12,722 |
| 2016 | $4,664 | $23,886 | $11,164 | $12,722 |
| 2015 | $2,718 | $22,725 | $12,288 | $10,437 |
| 2014 | $2,718 | $22,364 | $12,787 | $9,577 |
Source: Public Records
Map
Nearby Homes
- 200-21 Hollis Ave
- 19920 Hollis Ave
- 10967 203rd St
- 20202 109th Ave
- 11132 199th St
- 104-39 199th St
- 104-38 202nd St
- 10445 198th St
- 104-28 201st St
- 10411 200th St
- 204-06 109th Ave
- 112-28 199th St
- 111-09 205th St
- 205-28 110th Ave
- 112-32 204th St
- 111-39 205th St
- 194- 24 111th Rd
- 194-29 112th Ave
- 19404 110th Rd
- 204-20 104th Ave
- 109-81 200th St
- 109-77 200th St
- 10977 200th St
- 10985 200th St
- 10973 200th St
- 10989 200th St
- 10980 201st St
- 10976 201st St
- 10984 201st St
- 10976 201st St
- 10984 201st St
- 109-84 201st St
- 10969 200th St
- 10993 200th St
- 10988 201st St
- 10972 201st St
- 109-72 201st St
- 10988 201st St
- 10965 200th St
- 10978 200th St