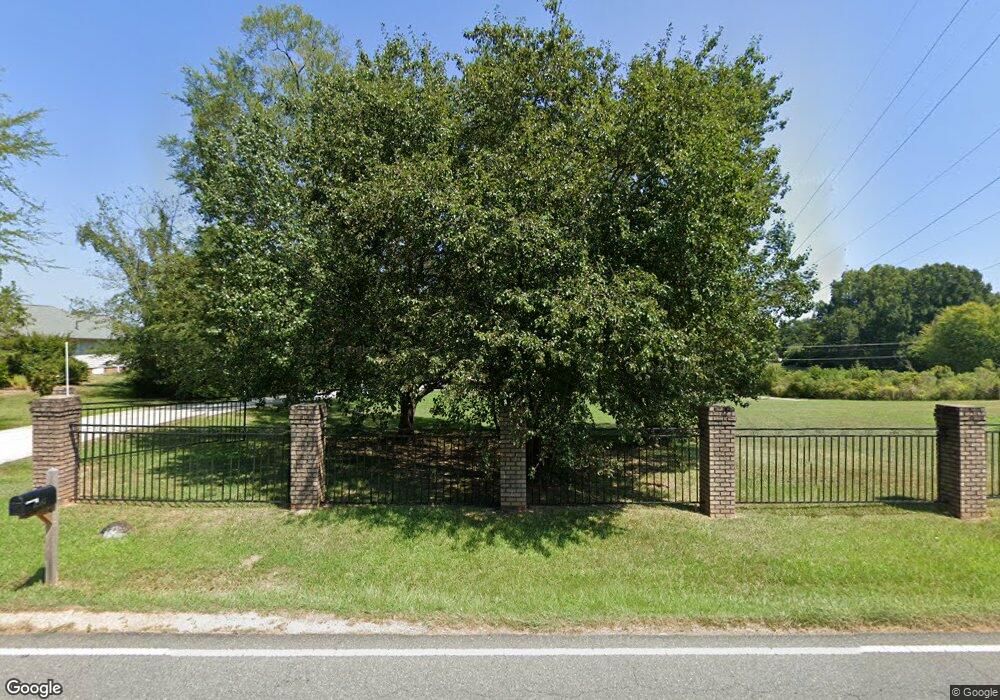
10987 Flowes Store Rd Midland, NC 28107
Estimated Value: $467,000 - $675,000
3
Beds
3
Baths
2,645
Sq Ft
$212/Sq Ft
Est. Value
About This Home
This home is located at 10987 Flowes Store Rd, Midland, NC 28107 and is currently estimated at $560,739, approximately $211 per square foot. 10987 Flowes Store Rd is a home located in Cabarrus County with nearby schools including Bethel Elementary School, C.C. Griffin Middle School, and Hickory Ridge High School.
Ownership History
Date
Name
Owned For
Owner Type
Purchase Details
Closed on
Apr 12, 2017
Sold by
Guillen Ruben and Fregoso Linda
Bought by
Guillen Ruben and Fregoso Linda
Current Estimated Value
Purchase Details
Closed on
Aug 30, 2007
Sold by
Hartsell Tamala Jane
Bought by
Guillen Ruben and Miranda Rosa I
Home Financials for this Owner
Home Financials are based on the most recent Mortgage that was taken out on this home.
Original Mortgage
$230,000
Outstanding Balance
$148,797
Interest Rate
7%
Mortgage Type
Purchase Money Mortgage
Estimated Equity
$411,942
Purchase Details
Closed on
Jul 29, 1999
Sold by
Vann Almond Ronald and Vann Katherine
Bought by
Hartsell Tamala Jane
Home Financials for this Owner
Home Financials are based on the most recent Mortgage that was taken out on this home.
Original Mortgage
$148,000
Interest Rate
6.5%
Mortgage Type
Purchase Money Mortgage
Create a Home Valuation Report for This Property
The Home Valuation Report is an in-depth analysis detailing your home's value as well as a comparison with similar homes in the area
Home Values in the Area
Average Home Value in this Area
Purchase History
| Date | Buyer | Sale Price | Title Company |
|---|---|---|---|
| Guillen Ruben | -- | None Available | |
| Guillen Ruben | $230,000 | None Available | |
| Hartsell Tamala Jane | $185,000 | -- |
Source: Public Records
Mortgage History
| Date | Status | Borrower | Loan Amount |
|---|---|---|---|
| Open | Guillen Ruben | $230,000 | |
| Previous Owner | Hartsell Tamala Jane | $148,000 |
Source: Public Records
Tax History Compared to Growth
Tax History
| Year | Tax Paid | Tax Assessment Tax Assessment Total Assessment is a certain percentage of the fair market value that is determined by local assessors to be the total taxable value of land and additions on the property. | Land | Improvement |
|---|---|---|---|---|
| 2025 | $3,207 | $474,410 | $93,170 | $381,240 |
| 2024 | $3,207 | $474,410 | $93,170 | $381,240 |
| 2023 | $2,522 | $300,290 | $48,060 | $252,230 |
| 2022 | $2,522 | $300,290 | $48,060 | $252,230 |
| 2021 | $2,432 | $300,290 | $48,060 | $252,230 |
| 2020 | $1,775 | $219,120 | $48,060 | $171,060 |
| 2019 | $1,691 | $208,720 | $58,850 | $149,870 |
| 2018 | $1,628 | $208,720 | $58,850 | $149,870 |
| 2017 | $1,586 | $208,720 | $58,850 | $149,870 |
| 2016 | $1,565 | $207,290 | $63,750 | $143,540 |
| 2015 | $1,546 | $207,290 | $63,750 | $143,540 |
| 2014 | $1,546 | $207,290 | $63,750 | $143,540 |
Source: Public Records
Map
Nearby Homes
- 10978 Sparkle Creek Dr
- 10072 Fox Trotter Ln
- 10024 Fox Trotter Ln
- 10045 Carousel Corral Dr
- 11247 Serenity Farm Dr
- 11354 Cedarvale Farm Pkwy
- 637 Iron Horse Ln
- 10911 Sparkle Creek Dr
- 10900 Sparkle Creek Dr
- 729 Sternbridge Dr
- 10803 McCamie Hill Place
- 1358 Rolling Hills Ct
- 11131 McCamie Hill Place
- 1423 Piper Ct
- 11761 Crossroads Place
- 1465 Porters Ct
- 12350 Hartwood Rd
- 11855 Sam Black Rd
- 999 Stones Throw Dr
- 12467 Ritchie Rd
- 10981 Flowes Store Rd
- 10875 Flowes Store Rd
- 11055 Flowes Store Rd
- 11080 Flowes Store Rd
- 11101 Flowes Store Rd
- 11093 Flowes Store Rd
- 10780 Flowes Store Rd
- 11055 Thornbeck Ln
- 11095 Flowes Store Rd
- 11047 Thornbeck Ln
- 11043 Thornbeck Ln
- 11033 Thornbeck Ln
- 11000 Flowes Store Rd
- 11029 Thornbeck Ln
- 11025 Thornbeck Ln
- 411 Iron Horse Ln Unit 69
- 411 Iron Horse Ln
- 11021 Thornbeck Ln
- 11034 Thornbeck Ln
- 10801 Flowes Store Rd