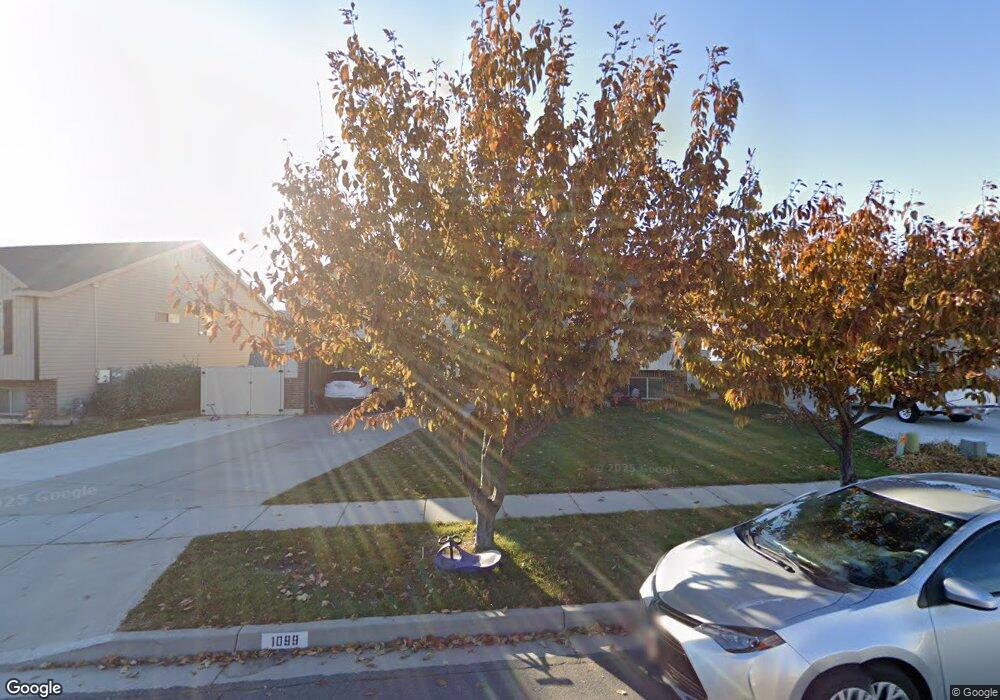
1099 N Jamie Matt Cir Unit 102 Layton, UT 84041
Estimated Value: $551,000 - $567,000
5
Beds
3
Baths
1,357
Sq Ft
$413/Sq Ft
Est. Value
About This Home
This home is located at 1099 N Jamie Matt Cir Unit 102, Layton, UT 84041 and is currently estimated at $560,942, approximately $413 per square foot. 1099 N Jamie Matt Cir Unit 102 is a home located in Davis County with nearby schools including Ellison Park School, Shoreline Junior High School, and Layton High School.
Ownership History
Date
Name
Owned For
Owner Type
Purchase Details
Closed on
Sep 14, 2020
Sold by
Farnes Dahln S
Bought by
Farnes Angel Aubree and Farnes Dahln Steven
Current Estimated Value
Home Financials for this Owner
Home Financials are based on the most recent Mortgage that was taken out on this home.
Original Mortgage
$282,100
Outstanding Balance
$249,305
Interest Rate
2.8%
Mortgage Type
New Conventional
Estimated Equity
$311,637
Purchase Details
Closed on
Apr 19, 2019
Sold by
Farnes Dahln S and Farnes Angel
Bought by
Farnes Dahln S
Home Financials for this Owner
Home Financials are based on the most recent Mortgage that was taken out on this home.
Original Mortgage
$280,000
Interest Rate
4.3%
Mortgage Type
New Conventional
Purchase Details
Closed on
Sep 19, 2012
Sold by
Farnes Dahln S
Bought by
Farnes Dahln S and Farnes Angel
Home Financials for this Owner
Home Financials are based on the most recent Mortgage that was taken out on this home.
Original Mortgage
$214,777
Interest Rate
3.25%
Mortgage Type
FHA
Create a Home Valuation Report for This Property
The Home Valuation Report is an in-depth analysis detailing your home's value as well as a comparison with similar homes in the area
Home Values in the Area
Average Home Value in this Area
Purchase History
| Date | Buyer | Sale Price | Title Company |
|---|---|---|---|
| Farnes Angel Aubree | -- | First American Title | |
| Farnes Dahln S | -- | Hickman Land Tit | |
| Farnes Dahln S | -- | Mountain View Title & | |
| Farnes Dahln S | -- | Mountain View Title & |
Source: Public Records
Mortgage History
| Date | Status | Borrower | Loan Amount |
|---|---|---|---|
| Open | Farnes Angel Aubree | $282,100 | |
| Closed | Farnes Dahln S | $280,000 | |
| Closed | Farnes Dahln S | $214,777 |
Source: Public Records
Tax History Compared to Growth
Tax History
| Year | Tax Paid | Tax Assessment Tax Assessment Total Assessment is a certain percentage of the fair market value that is determined by local assessors to be the total taxable value of land and additions on the property. | Land | Improvement |
|---|---|---|---|---|
| 2025 | $2,845 | $298,651 | $106,211 | $192,440 |
| 2024 | $2,746 | $290,400 | $118,446 | $171,954 |
| 2023 | $2,747 | $512,000 | $115,293 | $396,707 |
| 2022 | $3,005 | $304,150 | $73,391 | $230,759 |
| 2021 | $2,643 | $399,000 | $110,122 | $288,878 |
| 2020 | $2,382 | $345,000 | $92,264 | $252,736 |
| 2019 | $2,327 | $330,000 | $95,783 | $234,217 |
| 2018 | $2,107 | $300,000 | $83,884 | $216,116 |
| 2016 | $1,998 | $146,740 | $32,390 | $114,350 |
| 2015 | $1,723 | $120,175 | $32,390 | $87,785 |
| 2014 | $1,730 | $123,329 | $32,390 | $90,939 |
Source: Public Records
Map
Nearby Homes
- 1099 N 2475 W
- 1085 N 2475 W
- 1085 N Jamie Matt Cir Unit 103
- 1085 N Jamie Matt Cir
- 1113 N Jamie Matt Cir Unit 101
- 1113 N 2475 W
- 1075 Jamie-Matt Cir
- 1098 N 2525 W
- 1071 N 2475 W
- 1082 N 2525 W
- 1071 N Jamie Matt Cir Unit 104
- 1114 N 2525 W
- 1112 N Jamie Matt Cir Unit 108
- 1112 N 2475 W
- 1068 N 2525 W
- 1080 N Jamie Matt Cir Unit 106
- 1061 N Jamie Matt Cir Unit 105
- 1096 N 2475 W
- 1061 N 2475 W
- 1080 N 2475 W