
10992 Cloverhurst Way San Diego, CA 92130
Carmel Valley NeighborhoodHighlights
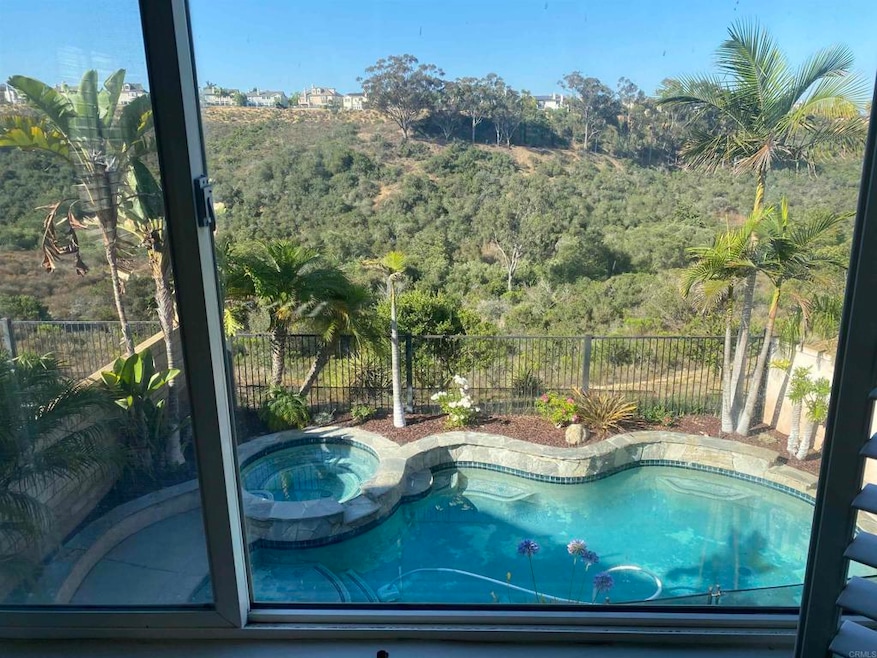
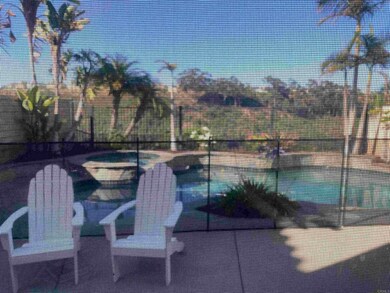
- In Ground Pool
- Canyon View
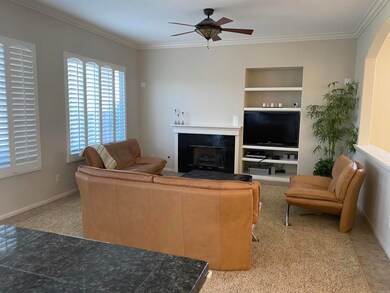
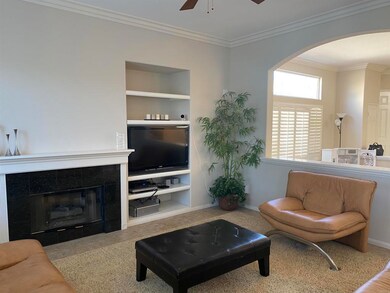
- Living Room
- Sage Canyon School Rated A+
- 3 Car Attached Garage
- Laundry Room
About This Home
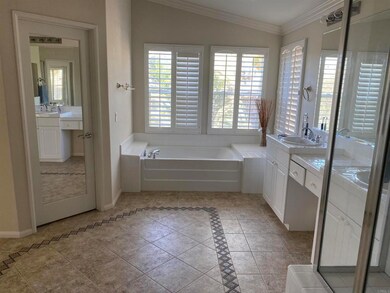
Nestled in the heart of Carmel Valley, this beautiful 5-bedroom, 3-bathroom home offers 2,597 square feet of inviting space and scenic canyon views Located on a very quiet street. The lush backyard features a sparkling a solar heated pool and spa, perfect for relaxing or entertaining while overlooking serene, green canyon landscapes. A spacious 3-car garage provides ample storage. Located in the Del Mar School District, near pristine beaches, and premier shopping, this home combines tranquil surroundings with prime access to the best of Carmel Valley living.
Listing Agent
Coldwell Banker West Brokerage Email: assaf@homesbyassaf.com License #01404616 Listed on: 11/12/2025

Home Details
Home Type
- Single Family
Est. Annual Taxes
- $13,597
Year Built
- Built in 1999
Lot Details
- 5,154 Sq Ft Lot
- Density is up to 1 Unit/Acre
- Property is zoned R-1:Single Fam-Res
Parking
- 3 Car Attached Garage
- 3 Open Parking Spaces
Property Views
- Canyon
- Neighborhood
Home Design
- Entry on the 1st floor
Interior Spaces
- 2,597 Sq Ft Home
- 2-Story Property
- Formal Entry
- Family Room with Fireplace
- Living Room
- Laundry Room
Bedrooms and Bathrooms
- 5 Bedrooms
- 3 Full Bathrooms
Utilities
- Central Air
- No Heating
Additional Features
- In Ground Pool
- Suburban Location
Listing and Financial Details
- Security Deposit $8,500
- Rent includes gardener
- Available 12/15/25
- Tax Lot /86
- Tax Tract Number 13506
- Assessor Parcel Number 3074815200
- Seller Considering Concessions
Community Details
Overview
- Property has a Home Owners Association
- Cav Subdivision
Pet Policy
- Pets Allowed
- Pet Deposit $500
Map
Source: California Regional Multiple Listing Service (CRMLS)
MLS Number: PTP2508524
APN: 307-481-52
Disclaimer: Certain information contained herein is derived from information provided by parties other than Homes.com. All information provided is deemed reliable, but is not guaranteed to be accurate and should be independently verified.
![]() The multiple listing data appearing on this website, or contained in reports produced therefrom, is owned and copyrighted by California Regional Multiple Listing Service, Inc. ("CRMLS") and is protected by all applicable copyright laws. Information provided is for viewer's personal, non-commercial use and may not be used for any purpose other than to identify prospective properties the viewer may be interested in purchasing. All listing data, including but not limited to square footage and lot size is believed to be accurate, but the listing Agent, listing Broker and CRMLS and its affiliates do not warrant or guarantee such accuracy. The viewer should independently verify the listed data prior to making any decisions based on such information by personal inspection and/or contacting a real estate professional.
The multiple listing data appearing on this website, or contained in reports produced therefrom, is owned and copyrighted by California Regional Multiple Listing Service, Inc. ("CRMLS") and is protected by all applicable copyright laws. Information provided is for viewer's personal, non-commercial use and may not be used for any purpose other than to identify prospective properties the viewer may be interested in purchasing. All listing data, including but not limited to square footage and lot size is believed to be accurate, but the listing Agent, listing Broker and CRMLS and its affiliates do not warrant or guarantee such accuracy. The viewer should independently verify the listed data prior to making any decisions based on such information by personal inspection and/or contacting a real estate professional.
Based on information from California Regional Multiple Listing Service, Inc. and /or other sources. All data, including all measurements and calculations of area, is obtained from various sources and has not been, and will not be, verified by broker or MLS. All information should be independently reviewed and verified for accuracy. Properties may or may not be listed by the office/agent presenting the information
- 5255 Greenwillow Ln
- 5398 Shannon Ridge Ln
- 10785 New Grove Unit 87
- 5171 Del Mar Mesa Rd
- 10553 Gaylemont Ln Unit 5
- 0 Grand Del Mar Place Unit VU 8-4-6
- 0 Grand Del Mar Place Unit VU 8-4-9
- 0 Grand Del Mar Place Unit VU 8-4-5 NDP2502279
- 4615 Da Vinci St
- 11649 Thistle Hill Place
- 12518 Cavallo St
- 4582 Mercurio St
- 3970 Santa Nella Place
- 6286 Belmont Trail Ct
- 4289 Calle Isabelino
- 6370 Carmel View S
- 0 Arroyo Sorrento Place Unit 250030141
- 4436 Heritage Glen Ln
- 4691 Terraza Mar Marvelosa
- 6181 Sunset Crest Way
- 4985 Manor Ridge Ln
- 10637 Golden Willow
- 2153 Winterset Dr
- 5286 Caminito Vista Lujo
- 5508 Caminito Exquisito Unit ID1062710P
- 4418 Shorepointe Way
- 11724 Carmel Creek Rd
- 11921 Carmel Creek Rd
- 4695 Torrey Cir
- 5671 Greenshade Rd
- 11008 Sunny Mesa Rd
- 11323 W San Raphael Driveway
- 12368 Carmel Country Rd Unit D207
- 11026 W Ocean Air Dr
- 12530 Carmel Creek Rd Unit 135
- 3730 Carmel View Rd
- 13121 Dressage Ln
- 12360 Carmel Country Rd Unit B202
- 12307 Caminito Mira Del Mar
- 13207 Sunset Point Way