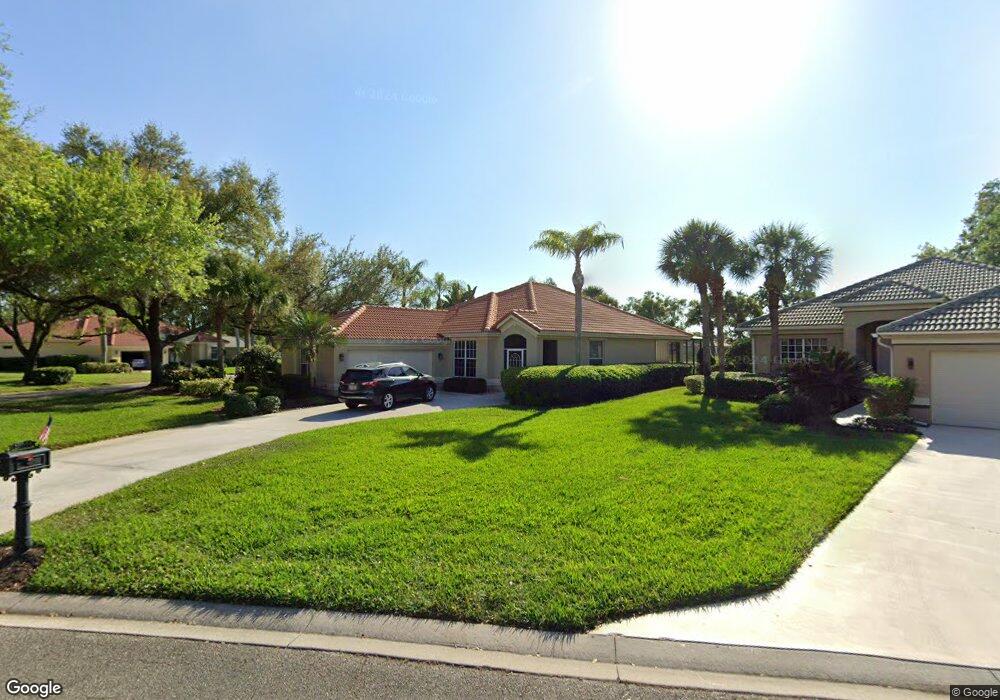
10998 Callaway Greens Ct Fort Myers, FL 33913
Gateway NeighborhoodEstimated Value: $404,438 - $476,000
3
Beds
2
Baths
2,024
Sq Ft
$215/Sq Ft
Est. Value
About This Home
This home is located at 10998 Callaway Greens Ct, Fort Myers, FL 33913 and is currently estimated at $435,110, approximately $214 per square foot. 10998 Callaway Greens Ct is a home located in Lee County with nearby schools including Gateway Elementary School, Tice Elementary School, and Orange River Elementary School.
Ownership History
Date
Name
Owned For
Owner Type
Purchase Details
Closed on
Oct 17, 2022
Sold by
Welch Maurice L and Welch Barbara P
Bought by
Wiegand Philip J and Wiegand Patricia L
Current Estimated Value
Home Financials for this Owner
Home Financials are based on the most recent Mortgage that was taken out on this home.
Original Mortgage
$200,000
Outstanding Balance
$171,829
Interest Rate
4.98%
Mortgage Type
New Conventional
Estimated Equity
$263,281
Purchase Details
Closed on
Jul 31, 1998
Sold by
Bay Colony Gateway Inc
Bought by
Welch Maurice L and Welch Barbara P
Home Financials for this Owner
Home Financials are based on the most recent Mortgage that was taken out on this home.
Original Mortgage
$115,500
Interest Rate
6.96%
Create a Home Valuation Report for This Property
The Home Valuation Report is an in-depth analysis detailing your home's value as well as a comparison with similar homes in the area
Home Values in the Area
Average Home Value in this Area
Purchase History
| Date | Buyer | Sale Price | Title Company |
|---|---|---|---|
| Wiegand Philip J | $435,000 | Security Title & Abstract | |
| Welch Maurice L | $165,500 | -- |
Source: Public Records
Mortgage History
| Date | Status | Borrower | Loan Amount |
|---|---|---|---|
| Open | Wiegand Philip J | $200,000 | |
| Previous Owner | Welch Maurice L | $115,500 |
Source: Public Records
Tax History Compared to Growth
Tax History
| Year | Tax Paid | Tax Assessment Tax Assessment Total Assessment is a certain percentage of the fair market value that is determined by local assessors to be the total taxable value of land and additions on the property. | Land | Improvement |
|---|---|---|---|---|
| 2025 | $6,691 | $377,572 | $80,750 | $294,132 |
| 2024 | $6,687 | $385,990 | $106,432 | $276,751 |
| 2023 | $6,687 | $399,230 | $103,326 | $293,604 |
| 2022 | $3,170 | $180,069 | $0 | $0 |
| 2021 | $3,051 | $217,847 | $65,468 | $152,379 |
| 2020 | $3,064 | $172,410 | $0 | $0 |
| 2019 | $2,899 | $168,534 | $0 | $0 |
| 2018 | $2,862 | $165,392 | $0 | $0 |
| 2017 | $2,771 | $161,990 | $0 | $0 |
| 2016 | $2,666 | $199,921 | $62,475 | $137,446 |
| 2015 | $2,626 | $182,108 | $59,850 | $122,258 |
| 2014 | -- | $180,696 | $55,000 | $125,696 |
| 2013 | -- | $169,301 | $35,000 | $134,301 |
Source: Public Records
Map
Nearby Homes
- 11146 Callaway Greens Dr
- 10951 Callaway Greens Ct
- 11195 Callaway Greens Dr
- 11268 Callaway Greens Dr
- 11229 Callaway Greens Dr
- 11550 Shady Palm Way
- 12022 Mahogany Isle Ln
- 10879 Pond Ridge Dr
- 11395 Shady Blossom Dr
- 11498 Tiverton Trace
- 11546 Onyx Cir
- 12020 Champions Green Way Unit 112
- 12051 Champions Green Way Unit 322
- 10614 Pistoia Dr
- 12031 Sabal Dunes Ln
- 12570 Lake Run Dr
- 11574 Onyx Cir
- 11289 Thurston Chase
- 12024 Cypress Links Dr
- 11283 Thurston Chase
- 11110 Callaway Greens Dr
- 10992 Callaway Greens Ct
- 10986 Callaway Greens Ct
- 11116 Callaway Greens Dr
- 11111 Callaway Greens Dr
- 10997 Callaway Greens Ct Unit 1
- 10997 Callaway Greens Ct
- 11101 Callaway Greens Dr
- 10987 Callaway Greens Ct
- 10980 Callaway Greens Ct
- 11122 Callaway Greens Dr
- 11308 Callaway Greens Dr Unit 42
- 11125 Callaway Greens Dr Unit 3
- 11125 Callaway Greens Dr
- 10974 Callaway Greens Ct
- 10975 Callaway Greens Ct
- 11304 Callaway Greens Dr
- 11299 Callaway Greens Dr
- 11128 Callaway Greens Dr
- 10968 Callaway Greens Ct