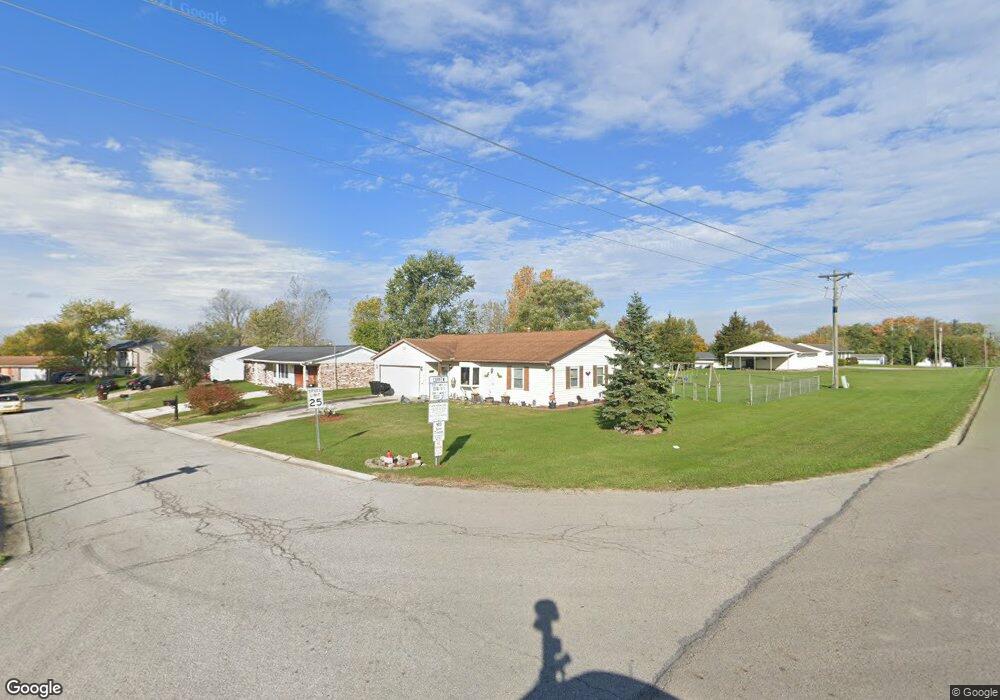
10999 Little Turtle Way Sidney, OH 45365
Estimated Value: $173,000 - $216,000
3
Beds
2
Baths
1,408
Sq Ft
$136/Sq Ft
Est. Value
About This Home
This home is located at 10999 Little Turtle Way, Sidney, OH 45365 and is currently estimated at $191,220, approximately $135 per square foot. 10999 Little Turtle Way is a home located in Shelby County with nearby schools including Hardin Houston Elementary School, Houston High School, and Holy Angels Catholic School.
Ownership History
Date
Name
Owned For
Owner Type
Purchase Details
Closed on
Feb 19, 2008
Sold by
Us Bank Na
Bought by
Foster Jerimy D and Johnson Viva D
Current Estimated Value
Home Financials for this Owner
Home Financials are based on the most recent Mortgage that was taken out on this home.
Original Mortgage
$66,300
Outstanding Balance
$41,226
Interest Rate
5.79%
Mortgage Type
Purchase Money Mortgage
Estimated Equity
$149,994
Purchase Details
Closed on
Oct 19, 2007
Sold by
Gibbs Walter D
Bought by
Us Bank Na and Structured Asset Investment Loan Trust 2
Purchase Details
Closed on
Jan 26, 1999
Sold by
Jarrett Charles R
Bought by
Sanford Helen R
Home Financials for this Owner
Home Financials are based on the most recent Mortgage that was taken out on this home.
Original Mortgage
$51,000
Interest Rate
6.76%
Mortgage Type
New Conventional
Create a Home Valuation Report for This Property
The Home Valuation Report is an in-depth analysis detailing your home's value as well as a comparison with similar homes in the area
Home Values in the Area
Average Home Value in this Area
Purchase History
| Date | Buyer | Sale Price | Title Company |
|---|---|---|---|
| Foster Jerimy D | $65,000 | Accutitle Agency Inc | |
| Us Bank Na | $60,000 | None Available | |
| Sanford Helen R | $80,000 | -- |
Source: Public Records
Mortgage History
| Date | Status | Borrower | Loan Amount |
|---|---|---|---|
| Open | Foster Jerimy D | $66,300 | |
| Previous Owner | Sanford Helen R | $51,000 |
Source: Public Records
Tax History Compared to Growth
Tax History
| Year | Tax Paid | Tax Assessment Tax Assessment Total Assessment is a certain percentage of the fair market value that is determined by local assessors to be the total taxable value of land and additions on the property. | Land | Improvement |
|---|---|---|---|---|
| 2024 | $1,664 | $47,810 | $6,800 | $41,010 |
| 2023 | $1,664 | $47,810 | $6,800 | $41,010 |
| 2022 | $1,342 | $32,730 | $6,480 | $26,250 |
| 2021 | $1,355 | $32,730 | $6,480 | $26,250 |
| 2020 | $1,289 | $32,730 | $6,480 | $26,250 |
| 2019 | $1,140 | $28,670 | $5,360 | $23,310 |
| 2018 | $1,117 | $28,670 | $5,360 | $23,310 |
| 2017 | $1,120 | $28,670 | $5,360 | $23,310 |
| 2016 | $1,104 | $28,970 | $5,360 | $23,610 |
| 2015 | $1,107 | $28,970 | $5,360 | $23,610 |
| 2014 | $1,107 | $28,970 | $5,360 | $23,610 |
| 2013 | $1,149 | $27,850 | $5,360 | $22,490 |
Source: Public Records
Map
Nearby Homes
- 10997 Little Turtle Way
- 10995 Little Turtle Way
- 10998 Little Turtle Way
- 10996 Little Turtle Way
- 3485 Lindsey Rd
- 10970 Schenk Rd
- 10993 Little Turtle Way
- 10990 Little Turtle Way
- 3304 Chief Tarkee Ct
- 10991 Little Turtle Way
- 3306 Chief Tarkee Ct
- 10964 Schenk Rd
- 10940 Schenk Rd
- 3308 Chief Tarkee Ct
- 3400 Chickasaw Ct
- 3402 Chickasaw Ct
- 3302 Chief Tarkee Ct
- 10908 Schenk Rd
- 0 Lindsey Rd
- 3309 Chief Tarkee Ct