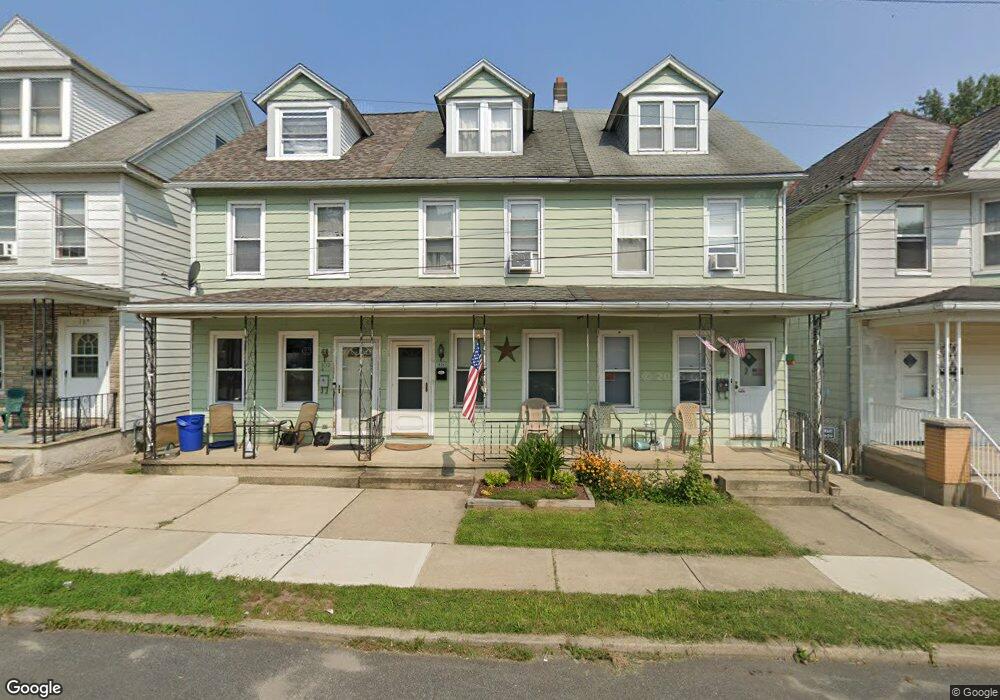
109A Glen Ave Phillipsburg, NJ 08865
Estimated Value: $136,492 - $252,000
--
Bed
--
Bath
1,176
Sq Ft
$175/Sq Ft
Est. Value
About This Home
This home is located at 109A Glen Ave, Phillipsburg, NJ 08865 and is currently estimated at $205,373, approximately $174 per square foot. 109A Glen Ave is a home located in Warren County with nearby schools including Phillipsburg High School, Easton Arts Academy Elementary Cs, and Sts. Philip & James School.
Ownership History
Date
Name
Owned For
Owner Type
Purchase Details
Closed on
Aug 27, 2003
Sold by
Vancamp Joyce M
Bought by
Vancamp Patricia A
Current Estimated Value
Purchase Details
Closed on
Aug 23, 1996
Sold by
Rovi Dina B
Bought by
Vancamp Joyce M and Vancamp Patricia A
Home Financials for this Owner
Home Financials are based on the most recent Mortgage that was taken out on this home.
Original Mortgage
$50,350
Outstanding Balance
$3,969
Interest Rate
8.18%
Mortgage Type
FHA
Estimated Equity
$201,404
Create a Home Valuation Report for This Property
The Home Valuation Report is an in-depth analysis detailing your home's value as well as a comparison with similar homes in the area
Home Values in the Area
Average Home Value in this Area
Purchase History
| Date | Buyer | Sale Price | Title Company |
|---|---|---|---|
| Vancamp Patricia A | -- | -- | |
| Vancamp Joyce M | $49,900 | -- |
Source: Public Records
Mortgage History
| Date | Status | Borrower | Loan Amount |
|---|---|---|---|
| Open | Vancamp Joyce M | $50,350 |
Source: Public Records
Tax History Compared to Growth
Tax History
| Year | Tax Paid | Tax Assessment Tax Assessment Total Assessment is a certain percentage of the fair market value that is determined by local assessors to be the total taxable value of land and additions on the property. | Land | Improvement |
|---|---|---|---|---|
| 2025 | $3,004 | $66,100 | $22,500 | $43,600 |
| 2024 | $2,774 | $66,100 | $22,500 | $43,600 |
| 2023 | $2,742 | $66,100 | $22,500 | $43,600 |
| 2022 | $2,742 | $66,100 | $22,500 | $43,600 |
| 2021 | $2,654 | $66,100 | $22,500 | $43,600 |
| 2020 | $2,672 | $66,100 | $22,500 | $43,600 |
| 2019 | $2,631 | $66,100 | $22,500 | $43,600 |
| 2018 | $2,631 | $66,100 | $22,500 | $43,600 |
| 2017 | $2,620 | $66,100 | $22,500 | $43,600 |
| 2016 | $2,579 | $66,100 | $22,500 | $43,600 |
| 2015 | $2,559 | $66,100 | $22,500 | $43,600 |
| 2014 | $2,476 | $66,100 | $22,500 | $43,600 |
Source: Public Records
Map
Nearby Homes