10N831 Il Route 47 Elgin, IL 60124
Plato Center NeighborhoodEstimated Value: $465,000 - $655,670
3
Beds
2
Baths
1,928
Sq Ft
$288/Sq Ft
Est. Value
About This Home
This home is located at 10N831 Il Route 47, Elgin, IL 60124 and is currently estimated at $554,890, approximately $287 per square foot. 10N831 Il Route 47 is a home with nearby schools including Howard B. Thomas Grade School, Central Middle School, and Prairie Knolls Middle School.
Ownership History
Date
Name
Owned For
Owner Type
Purchase Details
Closed on
Dec 22, 2020
Sold by
Kuschel Cynthia K and Neisendorf Pamela S
Bought by
Kcb Farms Llc
Current Estimated Value
Purchase Details
Closed on
Dec 26, 2012
Sold by
Bartels Kenneth H and Kenneth H Bartels Trust 101
Bought by
Bartels Kenneth H and Bartels Family Trust
Purchase Details
Closed on
Oct 10, 2008
Sold by
Schuring Virginia and Schuring Virginia L
Bought by
Schuring Virginia L and Virginia L Schuring Revocable
Purchase Details
Closed on
Mar 3, 2008
Sold by
Schuring Warren D and Schuring Alvin V
Bought by
Schuring Virginia
Purchase Details
Closed on
Dec 21, 1990
Sold by
Bartels Kenneth H and Meta S Bartels Testamentary Tr
Bought by
Bartels Kenneth H and The Kenneth H Bartels Trust #1
Purchase Details
Closed on
Jul 17, 1984
Sold by
Bartels Kenneth H and Bartels Meta S
Bought by
Bartels Kenneth H
Create a Home Valuation Report for This Property
The Home Valuation Report is an in-depth analysis detailing your home's value as well as a comparison with similar homes in the area
Home Values in the Area
Average Home Value in this Area
Purchase History
| Date | Buyer | Sale Price | Title Company |
|---|---|---|---|
| Kcb Farms Llc | -- | None Available | |
| Kuschel Cynthia K | -- | None Listed On Document | |
| Bartels Kenneth H | -- | None Available | |
| Schuring Virginia L | -- | None Available | |
| Schuring Virginia | -- | None Available | |
| Bartels Kenneth H | -- | -- | |
| Bartels Kenneth H | -- | -- | |
| Bartels Kenneth H | -- | -- |
Source: Public Records
Tax History Compared to Growth
Tax History
| Year | Tax Paid | Tax Assessment Tax Assessment Total Assessment is a certain percentage of the fair market value that is determined by local assessors to be the total taxable value of land and additions on the property. | Land | Improvement |
|---|---|---|---|---|
| 2024 | $9,703 | $140,540 | $69,590 | $70,950 |
| 2023 | $8,671 | $120,067 | $64,238 | $55,829 |
| 2022 | $9,011 | $115,735 | $59,906 | $55,829 |
| 2021 | $8,606 | $108,245 | $56,877 | $51,368 |
| 2020 | $8,438 | $104,879 | $54,434 | $50,445 |
| 2019 | $8,295 | $102,087 | $52,294 | $49,793 |
| 2018 | $7,670 | $95,629 | $48,207 | $47,422 |
| 2017 | $7,575 | $93,608 | $46,186 | $47,422 |
| 2016 | $7,937 | $90,643 | $44,346 | $46,297 |
| 2015 | -- | $89,378 | $43,081 | $46,297 |
| 2014 | -- | $86,591 | $43,522 | $43,069 |
| 2013 | -- | $85,493 | $41,688 | $43,805 |
Source: Public Records
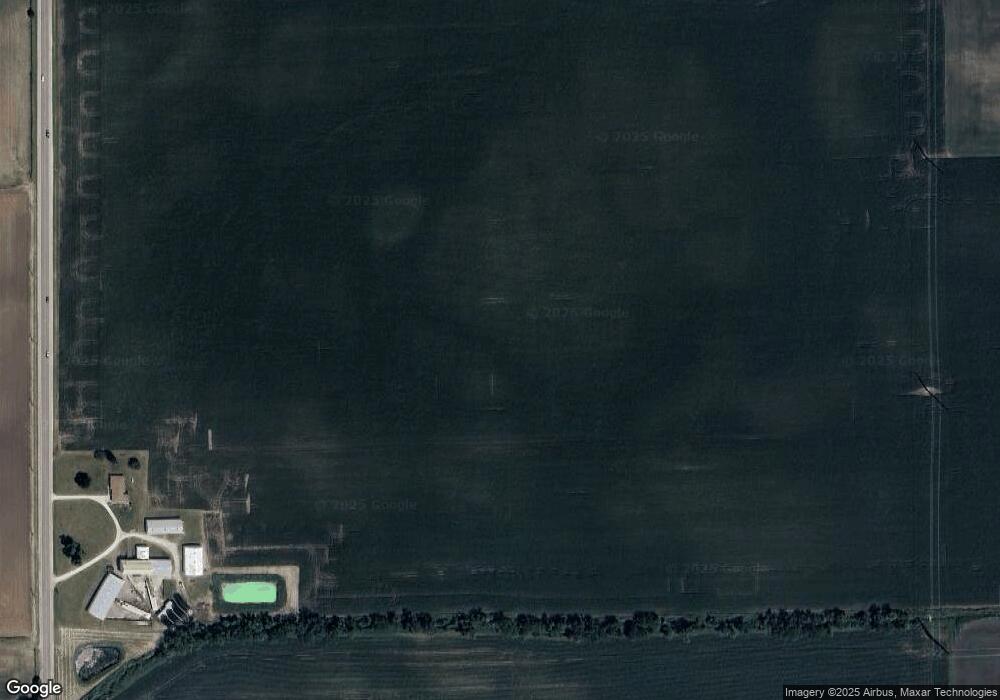
Map
Nearby Homes
- 10N874 Rippburger Rd
- 42W565 Hummingbird St
- 44W465 Plank Rd
- 1853 Chandolin Ln
- 1831 Chandolin Ln
- 1855 Chandolin Ln
- 41W072 Bowes Rd
- 41W591 Lenz Rd
- 44W005 Ellithorpe Rd
- 10N701 Prairie Crossing
- 300 Astor Ct
- 312 Astor Ct
- 1857 Diamond Dr
- 308 Astor Ct
- 1843 Diamond Dr
- 310 Astor Ct
- 314 Astor Ct
- 40W513 Old Mill Ct
- 4378 John Milton Rd
- 44W669 Ramm Rd
- 0 Il Route 47
- 43W244 Plato Rd
- 43W220 Plato Rd
- 43W168 Plato Rd
- 10N390 Il Route 47
- 10N390 Illinois 47
- 43W719 Plato Rd
- 10N324 Il Route 47
- 10N293 Il Route 47
- 43W827 Plato Rd
- 43W775 Plato Rd
- 43W891 Plato Rd
- 10n443 Kendall Rd
- 10n254 Il Route 47
- 43W957 Plato Rd
- 10N218 Rte 47
- 10n218 Il Route 47
- 43W479 Rohrsen Rd
- 10N180 Il Route 47
- 10N151 Il Route 47