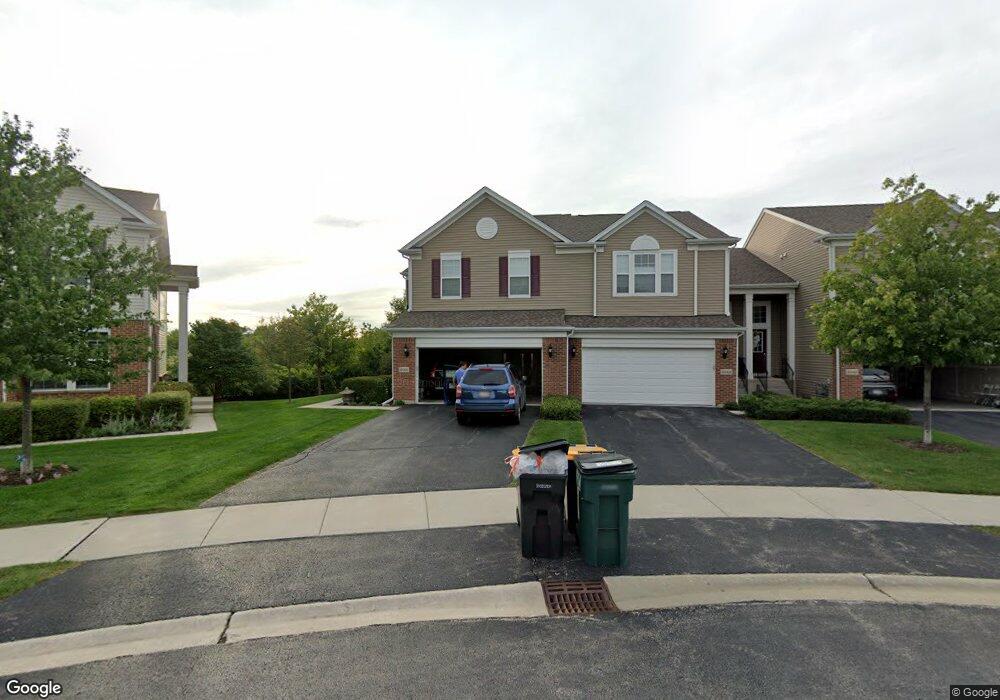
10S422 Carrington Cir Unit 3-1 Burr Ridge, IL 60527
Waterfall Glen NeighborhoodEstimated Value: $392,000 - $647,000
3
Beds
3
Baths
2,100
Sq Ft
$245/Sq Ft
Est. Value
About This Home
This home is located at 10S422 Carrington Cir Unit 3-1, Burr Ridge, IL 60527 and is currently estimated at $513,977, approximately $244 per square foot. 10S422 Carrington Cir Unit 3-1 is a home located in DuPage County with nearby schools including Anne M. Jeans Elementary School, Burr Ridge Middle School, and Hinsdale South High School.
Ownership History
Date
Name
Owned For
Owner Type
Purchase Details
Closed on
Mar 14, 2022
Sold by
Dee Nazario
Bought by
Chogsom Boldbaatar
Current Estimated Value
Home Financials for this Owner
Home Financials are based on the most recent Mortgage that was taken out on this home.
Original Mortgage
$380,000
Outstanding Balance
$354,761
Interest Rate
3.85%
Mortgage Type
New Conventional
Estimated Equity
$159,216
Purchase Details
Closed on
Sep 13, 2011
Sold by
Pulte Home Corporation
Bought by
Nazario Demetrius A and Balaoing Esterlita K
Home Financials for this Owner
Home Financials are based on the most recent Mortgage that was taken out on this home.
Original Mortgage
$296,307
Interest Rate
4.09%
Mortgage Type
FHA
Create a Home Valuation Report for This Property
The Home Valuation Report is an in-depth analysis detailing your home's value as well as a comparison with similar homes in the area
Home Values in the Area
Average Home Value in this Area
Purchase History
| Date | Buyer | Sale Price | Title Company |
|---|---|---|---|
| Chogsom Boldbaatar | $400,000 | Fidelity National Title | |
| Nazario Demetrius A | $304,500 | None Available |
Source: Public Records
Mortgage History
| Date | Status | Borrower | Loan Amount |
|---|---|---|---|
| Open | Chogsom Boldbaatar | $380,000 | |
| Previous Owner | Nazario Demetrius A | $296,307 |
Source: Public Records
Tax History Compared to Growth
Tax History
| Year | Tax Paid | Tax Assessment Tax Assessment Total Assessment is a certain percentage of the fair market value that is determined by local assessors to be the total taxable value of land and additions on the property. | Land | Improvement |
|---|---|---|---|---|
| 2024 | $8,994 | $165,966 | $29,784 | $136,182 |
| 2023 | $8,643 | $152,570 | $27,380 | $125,190 |
| 2022 | $7,556 | $135,480 | $24,310 | $111,170 |
| 2021 | $7,242 | $133,940 | $24,030 | $109,910 |
| 2020 | $7,129 | $131,280 | $23,550 | $107,730 |
| 2019 | $6,849 | $125,970 | $22,600 | $103,370 |
| 2018 | $5,695 | $122,300 | $21,940 | $100,360 |
| 2017 | $5,641 | $117,680 | $21,110 | $96,570 |
| 2016 | $5,498 | $112,310 | $20,150 | $92,160 |
| 2015 | $5,443 | $105,670 | $18,960 | $86,710 |
| 2014 | $4,495 | $78,080 | $15,620 | $62,460 |
| 2013 | $4,342 | $77,720 | $15,550 | $62,170 |
Source: Public Records
Map
Nearby Homes
- 13 Kingery Quarter Unit 106B
- 17A Kingery Quarter Unit 102
- 14B Kingery Quarter Unit 207
- 4A Kingery Quarter Unit 104
- 5B Kingery Quarter Unit 107
- 24A Kingery Quarter Unit 202
- 11B Kingery Quarter Unit 107
- 2B Kingery Quarter Unit 207
- 12B Kingery Quarter Unit 108
- 22A Kingery Quarter Unit 202
- 16W234 91st St
- 17W060 Burr Oak Ln
- 9233 Falling Waters Dr W
- 4 Oak Hill Ct
- 16W122 91st St
- 16W318 95th Place
- 17W033 87th St
- 9427 Falling Waters Dr W
- 8625 Meadowbrook Dr
- 10S370 Madison St
- 10S422 Carrington Cir
- 10S420 Carrington Cir
- 10S420 Carrington Cir Unit A
- 10S420 Carrington Cir Unit 3-2
- 10S420 Carrington Cir Unit 1
- 10S418 Carrington Cir Unit 418
- 10S418 Carrington Cir
- 10S418 Carrington Cir Unit 3-3
- 10S440 Carrington Cir Unit 4-4
- 10S416 Carrington Cir
- 10S442 Carrington Cir Unit 4-3
- 10S442 Carrington Cir
- 10S414 Carrington Cir Unit 21
- 10S444 Carrington Cir Unit 105444
- 10S444 Carrington Cir Unit 4-2
- 10S412 Carrington Cir
- 10S412 Carrington Cir Unit 2-2
- 16W551 91st St
- 16w 91st St
- 10S421 Echo Ln