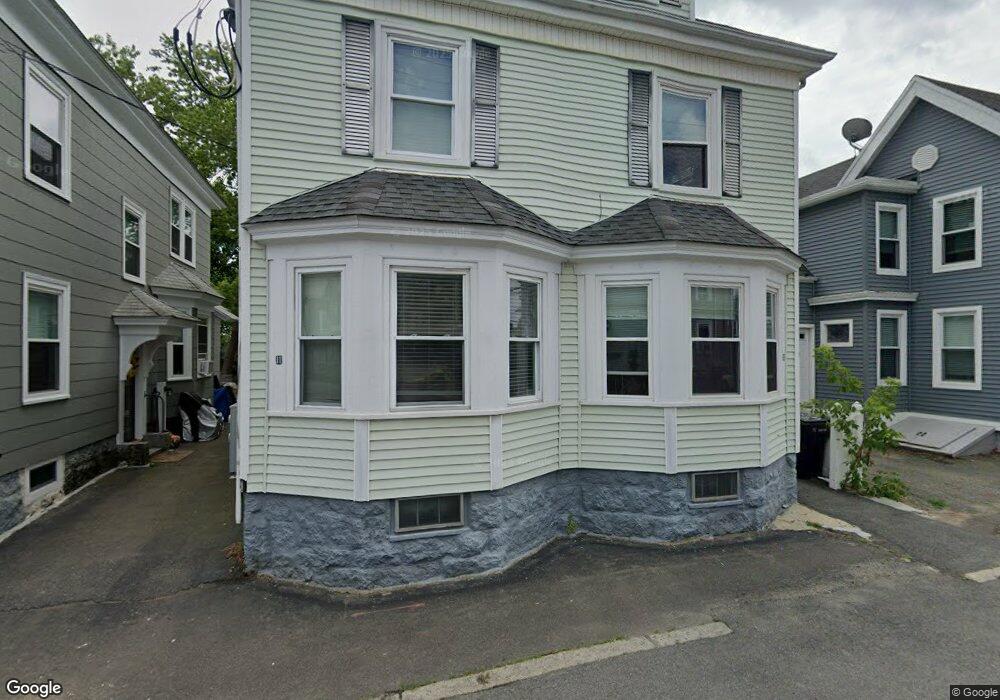
11 1/2 E Collins St Salem, MA 01970
Bridge Street NeighborhoodEstimated Value: $697,000 - $844,207
6
Beds
2
Baths
2,243
Sq Ft
$337/Sq Ft
Est. Value
About This Home
This home is located at 11 1/2 E Collins St, Salem, MA 01970 and is currently estimated at $756,802, approximately $337 per square foot. 11 1/2 E Collins St is a home located in Essex County with nearby schools including Carlton Elementary School, Saltonstall School, and Bates Elementary School.
Ownership History
Date
Name
Owned For
Owner Type
Purchase Details
Closed on
Nov 21, 2025
Sold by
Lawrence Jordan
Bought by
Lawrence Jordan
Current Estimated Value
Home Financials for this Owner
Home Financials are based on the most recent Mortgage that was taken out on this home.
Original Mortgage
$634,088
Outstanding Balance
$632,527
Interest Rate
4.88%
Mortgage Type
New Conventional
Estimated Equity
$124,275
Purchase Details
Closed on
Jun 11, 2021
Sold by
Leone Barbara and Leone George
Bought by
Lawrence Jordan and Roark Laura A
Home Financials for this Owner
Home Financials are based on the most recent Mortgage that was taken out on this home.
Original Mortgage
$567,000
Interest Rate
2.9%
Mortgage Type
Purchase Money Mortgage
Purchase Details
Closed on
Jun 7, 2021
Sold by
Leone Joseph R
Bought by
Leone George and Leone Barbara
Home Financials for this Owner
Home Financials are based on the most recent Mortgage that was taken out on this home.
Original Mortgage
$567,000
Interest Rate
2.9%
Mortgage Type
Purchase Money Mortgage
Purchase Details
Closed on
Dec 3, 1984
Bought by
Leone George and Leone Barbara
Create a Home Valuation Report for This Property
The Home Valuation Report is an in-depth analysis detailing your home's value as well as a comparison with similar homes in the area
Home Values in the Area
Average Home Value in this Area
Purchase History
| Date | Buyer | Sale Price | Title Company |
|---|---|---|---|
| Lawrence Jordan | -- | -- | |
| Lawrence Jordan | $600,000 | None Available | |
| Lawrence Jordan | $600,000 | None Available | |
| Leone George | -- | None Available | |
| Leone George | $119,000 | -- |
Source: Public Records
Mortgage History
| Date | Status | Borrower | Loan Amount |
|---|---|---|---|
| Open | Lawrence Jordan | $634,088 | |
| Previous Owner | Lawrence Jordan | $567,000 | |
| Previous Owner | Leone George | $15,000 |
Source: Public Records
Tax History
| Year | Tax Paid | Tax Assessment Tax Assessment Total Assessment is a certain percentage of the fair market value that is determined by local assessors to be the total taxable value of land and additions on the property. | Land | Improvement |
|---|---|---|---|---|
| 2025 | $7,510 | $662,300 | $161,400 | $500,900 |
| 2024 | $7,170 | $617,000 | $152,900 | $464,100 |
| 2023 | $7,014 | $560,700 | $141,600 | $419,100 |
| 2022 | $6,985 | $527,200 | $133,100 | $394,100 |
| 2021 | $5,640 | $408,700 | $133,100 | $275,600 |
| 2020 | $5,247 | $363,100 | $115,000 | $248,100 |
| 2019 | $5,167 | $342,200 | $109,300 | $232,900 |
| 2018 | $4,674 | $303,900 | $104,200 | $199,700 |
| 2017 | $4,515 | $284,700 | $85,000 | $199,700 |
| 2016 | $4,389 | $280,100 | $80,400 | $199,700 |
| 2015 | $4,153 | $253,100 | $72,500 | $180,600 |
Source: Public Records
Map
Nearby Homes
- 21 Emerton St Unit 2
- 17 Webb St Unit 1
- 8 Webb St
- 31 N Washington Square Unit 3
- 40 Essex St Unit 2
- 7 Forrester St
- 16 Williams St
- 11 Williams St Unit 2
- 69 Essex St Unit 2
- 41 Dearborn St
- 17 Orchard St
- 7 Curtis St Unit 1
- 131 Derby St Unit 3F
- 16 Franklin St Unit 2403
- 16 Franklin St Unit 1303
- 16 Franklin St Unit 2202
- 10.5 Herbert St Unit 21
- 12 Summit Ave Unit 4
- 7 Lothrop St
- 11 Church St Unit 203
- 11 1/2 E Collins St Unit right
- 9 1/2 E Collins St
- 9 E Collins St Unit 2
- 9 E Collins St Unit 1
- 9 1/2 E Collins St Unit 1
- 9 E Collins St
- 41 Osgood St Unit 43
- 43 Osgood St Unit 43
- 41 Osgood St Unit 41
- 43 Osgood St
- 39 Osgood St
- 7 E Collins St
- 47 Osgood St
- 12 E Collins St
- 35 Osgood St
- 10 E Collins St
- 5 E Collins St
- 51 Osgood St
- 49 Osgood St
- 33 Osgood St Unit 1
Your Personal Tour Guide
Ask me questions while you tour the home.