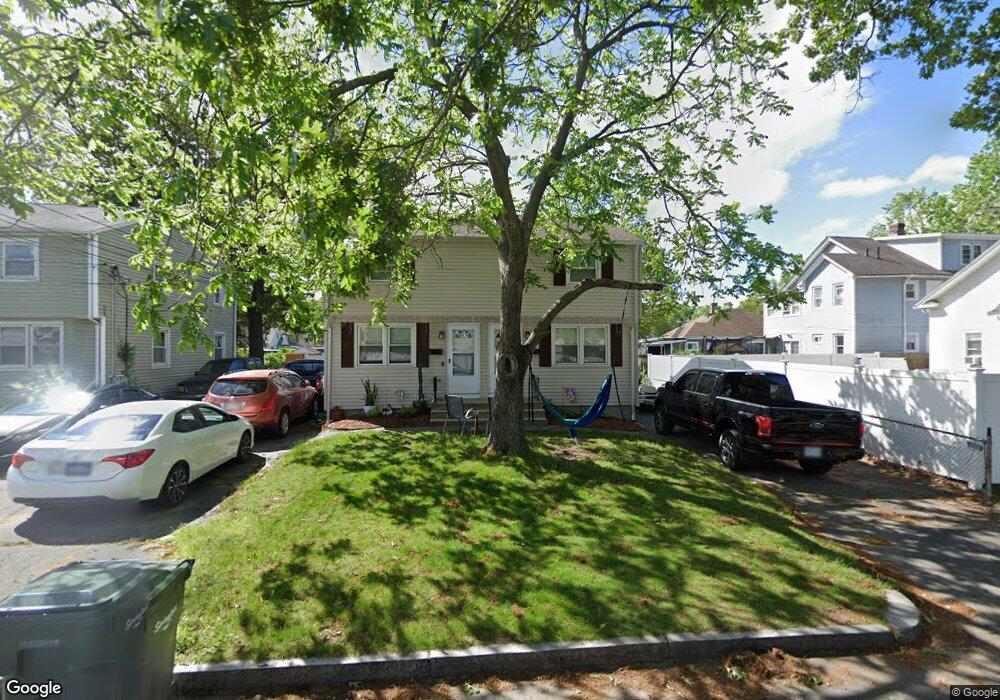
11-13 Flagg St Springfield, MA 01109
Pine Point NeighborhoodEstimated Value: $303,005 - $499,000
4
Beds
2
Baths
1,710
Sq Ft
$220/Sq Ft
Est. Value
About This Home
This home is located at 11-13 Flagg St, Springfield, MA 01109 and is currently estimated at $375,751, approximately $219 per square foot. 11-13 Flagg St is a home located in Hampden County with nearby schools including Hiram L. Dorman Elementary, John F. Kennedy Academy, and Springfield Central High School.
Ownership History
Date
Name
Owned For
Owner Type
Purchase Details
Closed on
May 4, 2001
Sold by
Lortie Steven C and Lortie Cathleen A
Bought by
Gorden Michelle R
Current Estimated Value
Home Financials for this Owner
Home Financials are based on the most recent Mortgage that was taken out on this home.
Original Mortgage
$88,511
Interest Rate
6.85%
Mortgage Type
Purchase Money Mortgage
Purchase Details
Closed on
Dec 1, 1988
Sold by
Moran Barbara S
Bought by
Lortie Steven C
Home Financials for this Owner
Home Financials are based on the most recent Mortgage that was taken out on this home.
Original Mortgage
$80,000
Interest Rate
10.19%
Mortgage Type
Purchase Money Mortgage
Create a Home Valuation Report for This Property
The Home Valuation Report is an in-depth analysis detailing your home's value as well as a comparison with similar homes in the area
Home Values in the Area
Average Home Value in this Area
Purchase History
| Date | Buyer | Sale Price | Title Company |
|---|---|---|---|
| Gorden Michelle R | $89,900 | -- | |
| Lortie Steven C | $103,000 | -- |
Source: Public Records
Mortgage History
| Date | Status | Borrower | Loan Amount |
|---|---|---|---|
| Open | Lortie Steven C | $108,700 | |
| Closed | Lortie Steven C | $88,511 | |
| Previous Owner | Lortie Steven C | $56,000 | |
| Previous Owner | Lortie Steven C | $80,000 |
Source: Public Records
Tax History
| Year | Tax Paid | Tax Assessment Tax Assessment Total Assessment is a certain percentage of the fair market value that is determined by local assessors to be the total taxable value of land and additions on the property. | Land | Improvement |
|---|---|---|---|---|
| 2025 | $4,306 | $274,600 | $39,000 | $235,600 |
| 2024 | $3,917 | $243,900 | $32,500 | $211,400 |
| 2023 | $3,746 | $219,700 | $29,500 | $190,200 |
| 2022 | $3,542 | $188,200 | $27,600 | $160,600 |
| 2021 | $3,402 | $180,000 | $25,100 | $154,900 |
| 2020 | $3,174 | $162,500 | $25,100 | $137,400 |
| 2019 | $2,932 | $149,000 | $25,100 | $123,900 |
| 2018 | $2,830 | $143,800 | $25,100 | $118,700 |
| 2017 | $2,902 | $147,600 | $23,200 | $124,400 |
| 2016 | $2,662 | $135,400 | $23,200 | $112,200 |
| 2015 | $2,516 | $127,900 | $23,200 | $104,700 |
Source: Public Records
Map
Nearby Homes
Your Personal Tour Guide
Ask me questions while you tour the home.