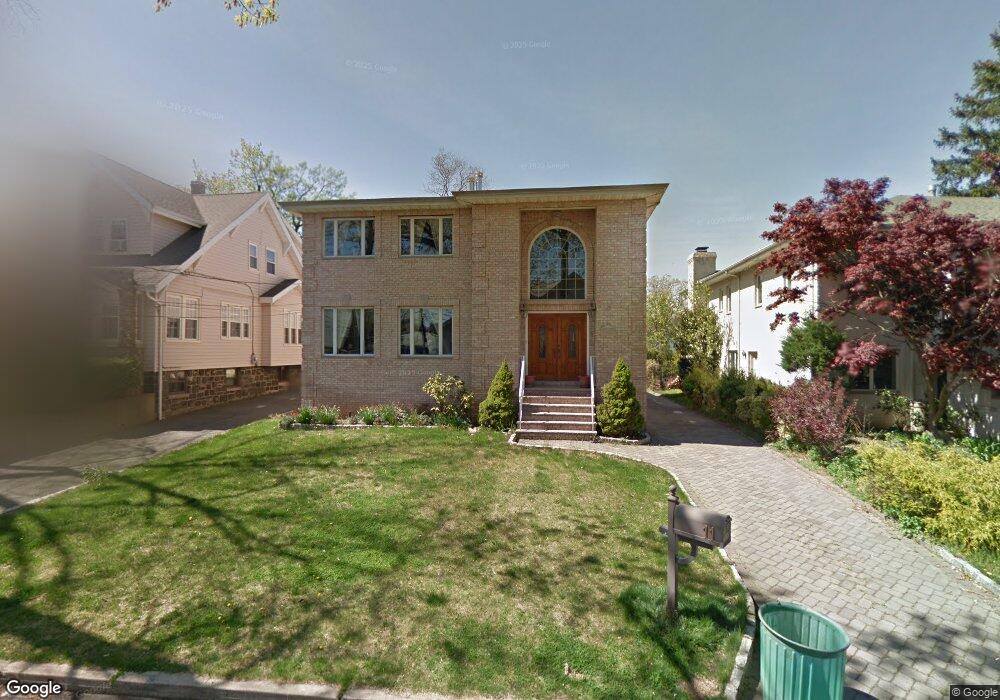
11 2nd St Englewood Cliffs, NJ 07632
Estimated Value: $1,590,597 - $1,731,000
--
Bed
--
Bath
3,296
Sq Ft
$509/Sq Ft
Est. Value
About This Home
This home is located at 11 2nd St, Englewood Cliffs, NJ 07632 and is currently estimated at $1,677,149, approximately $508 per square foot. 11 2nd St is a home located in Bergen County with nearby schools including North Cliff Elementary School, Upper School Elementary School, and Christ the Teacher Academy.
Ownership History
Date
Name
Owned For
Owner Type
Purchase Details
Closed on
Mar 22, 2016
Bought by
Byongchae Pak
Current Estimated Value
Home Financials for this Owner
Home Financials are based on the most recent Mortgage that was taken out on this home.
Original Mortgage
$600,000
Outstanding Balance
$476,156
Interest Rate
3.73%
Estimated Equity
$1,200,993
Purchase Details
Closed on
Mar 16, 2000
Sold by
Ohashi Mayumi
Bought by
Linley John and Linley Lucy Yang
Home Financials for this Owner
Home Financials are based on the most recent Mortgage that was taken out on this home.
Original Mortgage
$70,000
Interest Rate
7.85%
Purchase Details
Closed on
Mar 2, 1999
Sold by
Karamitsos John
Bought by
Ohashi Mayumi
Home Financials for this Owner
Home Financials are based on the most recent Mortgage that was taken out on this home.
Original Mortgage
$269,900
Interest Rate
6.76%
Create a Home Valuation Report for This Property
The Home Valuation Report is an in-depth analysis detailing your home's value as well as a comparison with similar homes in the area
Home Values in the Area
Average Home Value in this Area
Purchase History
| Date | Buyer | Sale Price | Title Company |
|---|---|---|---|
| Byongchae Pak | -- | -- | |
| Linley John | $328,000 | -- | |
| Ohashi Mayumi | $299,900 | -- |
Source: Public Records
Mortgage History
| Date | Status | Borrower | Loan Amount |
|---|---|---|---|
| Open | Byongchae Pak | $600,000 | |
| Closed | Byongchae Pak | -- | |
| Previous Owner | Linley John | $70,000 | |
| Previous Owner | Ohashi Mayumi | $269,900 |
Source: Public Records
Tax History Compared to Growth
Tax History
| Year | Tax Paid | Tax Assessment Tax Assessment Total Assessment is a certain percentage of the fair market value that is determined by local assessors to be the total taxable value of land and additions on the property. | Land | Improvement |
|---|---|---|---|---|
| 2025 | $13,283 | $1,150,000 | $587,100 | $562,900 |
| 2024 | $13,122 | $1,150,000 | $587,100 | $562,900 |
| 2023 | $12,915 | $1,150,000 | $587,100 | $562,900 |
| 2022 | $12,915 | $1,150,000 | $587,100 | $562,900 |
| 2021 | $9,928 | $1,150,000 | $587,100 | $562,900 |
| 2020 | $13,237 | $1,150,000 | $587,100 | $562,900 |
| 2019 | $12,432 | $1,150,000 | $587,100 | $562,900 |
| 2018 | $11,995 | $1,150,000 | $587,100 | $562,900 |
| 2017 | $11,477 | $1,150,000 | $587,100 | $562,900 |
| 2016 | $11,259 | $1,150,000 | $587,100 | $562,900 |
| 2015 | $10,445 | $1,150,000 | $587,100 | $562,900 |
| 2014 | $9,755 | $1,150,000 | $587,100 | $562,900 |
Source: Public Records
Map
Nearby Homes
- 2460 1st St
- 2455 3rd St
- 2446 3rd St
- 51 Anderson Ave
- 2410 3rd St
- 422 Myrtle Ave
- 424 Myrtle Ave
- 54 Van Nostrand Ave
- 52 Birch St
- 12 Summit St
- 2445 6th St
- 485 Westview Place
- 2345 Linwood Ave Unit 4H
- 2345 Linwood Ave Unit LG
- 505 Adele Ct
- 2350 Linwood Ave Unit 5C
- 2352 Linwood Ave Unit 5A
- 410 Fairview Ave Unit 4D
- 2468 7th St Unit B
- 470 Myrtle Ave