Estimated Value: $460,446 - $652,000
4
Beds
2
Baths
1,736
Sq Ft
$313/Sq Ft
Est. Value
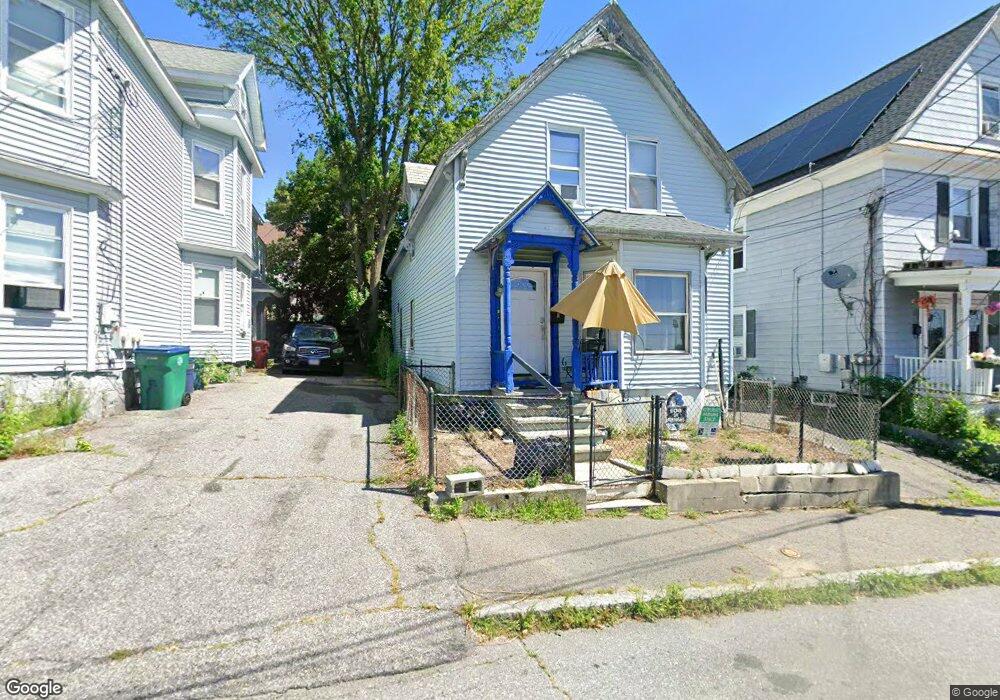
About This Home
This home is located at 11 A St, Lowell, MA 01851 and is currently estimated at $543,112, approximately $312 per square foot. 11 A St is a home located in Middlesex County with nearby schools including Abraham Lincoln Elementary School, Charles W. Morey Elementary School, and Dr. Gertrude Bailey Elementary School.
Ownership History
Date
Name
Owned For
Owner Type
Purchase Details
Closed on
Jan 4, 2022
Sold by
Rivera Ely E
Bought by
Rosario Julio I
Current Estimated Value
Purchase Details
Closed on
Aug 28, 1997
Sold by
11 A Street Rt and Hsu Ely P
Bought by
Rivera Ely E
Home Financials for this Owner
Home Financials are based on the most recent Mortgage that was taken out on this home.
Original Mortgage
$82,924
Interest Rate
7.41%
Mortgage Type
Purchase Money Mortgage
Purchase Details
Closed on
Nov 12, 1993
Sold by
Jeanne Darc Cu
Bought by
Hsu Ely Phlek
Purchase Details
Closed on
Oct 5, 1992
Sold by
Gallagher Thomas and Gallagher Rita
Bought by
Jeanne Darc Cu
Purchase Details
Closed on
Aug 21, 1987
Sold by
Geoffray Steve D
Bought by
Gallagher Thomas E
Create a Home Valuation Report for This Property
The Home Valuation Report is an in-depth analysis detailing your home's value as well as a comparison with similar homes in the area
Home Values in the Area
Average Home Value in this Area
Purchase History
| Date | Buyer | Sale Price | Title Company |
|---|---|---|---|
| Rosario Julio I | -- | None Available | |
| Rosario Julio I | -- | None Available | |
| Rivera Ely E | $83,000 | -- | |
| Rivera Ely E | $83,000 | -- | |
| Hsu Ely Phlek | $42,000 | -- | |
| Hsu Ely Phlek | $42,000 | -- | |
| Jeanne Darc Cu | $120,854 | -- | |
| Jeanne Darc Cu | $120,854 | -- | |
| Gallagher Thomas E | $150,000 | -- |
Source: Public Records
Mortgage History
| Date | Status | Borrower | Loan Amount |
|---|---|---|---|
| Previous Owner | Gallagher Thomas E | $82,822 | |
| Previous Owner | Gallagher Thomas E | $82,924 |
Source: Public Records
Tax History
| Year | Tax Paid | Tax Assessment Tax Assessment Total Assessment is a certain percentage of the fair market value that is determined by local assessors to be the total taxable value of land and additions on the property. | Land | Improvement |
|---|---|---|---|---|
| 2025 | $4,397 | $383,000 | $106,700 | $276,300 |
| 2024 | $4,097 | $344,000 | $99,700 | $244,300 |
| 2023 | $3,807 | $306,500 | $86,700 | $219,800 |
| 2022 | $3,393 | $267,400 | $68,500 | $198,900 |
| 2021 | $3,148 | $233,900 | $59,600 | $174,300 |
| 2020 | $2,945 | $220,400 | $59,600 | $160,800 |
| 2019 | $2,881 | $205,200 | $56,700 | $148,500 |
| 2018 | $2,691 | $187,000 | $54,000 | $133,000 |
| 2017 | $2,593 | $173,800 | $52,300 | $121,500 |
| 2016 | $2,579 | $170,100 | $48,600 | $121,500 |
| 2015 | $2,474 | $159,800 | $48,600 | $111,200 |
| 2013 | $2,301 | $153,300 | $58,300 | $95,000 |
Source: Public Records
Map
Nearby Homes
- 9 A St Unit 2
- 15 A St
- 7 A St
- 21 A St
- 423 Chelmsford St
- 423 Chelmsford St Unit 425
- 423 Chelmsford St Unit 2
- 427 Chelmsford St
- 425 Chelmsford St Unit 2nd Floor
- 425 Chelmsford St Unit 2
- 425 Chelmsford St Unit 425
- 425 Chelmsford St
- 20 Waite St Unit 2
- 20 Waite St Unit 5
- 20 Waite St Unit 1
- 20 Waite St Unit 4
- 419 Chelmsford St Unit 6
- 419 Chelmsford St Unit 3
- 419 Chelmsford St Unit 4
- 419 Chelmsford St Unit 7
Your Personal Tour Guide
Ask me questions while you tour the home.