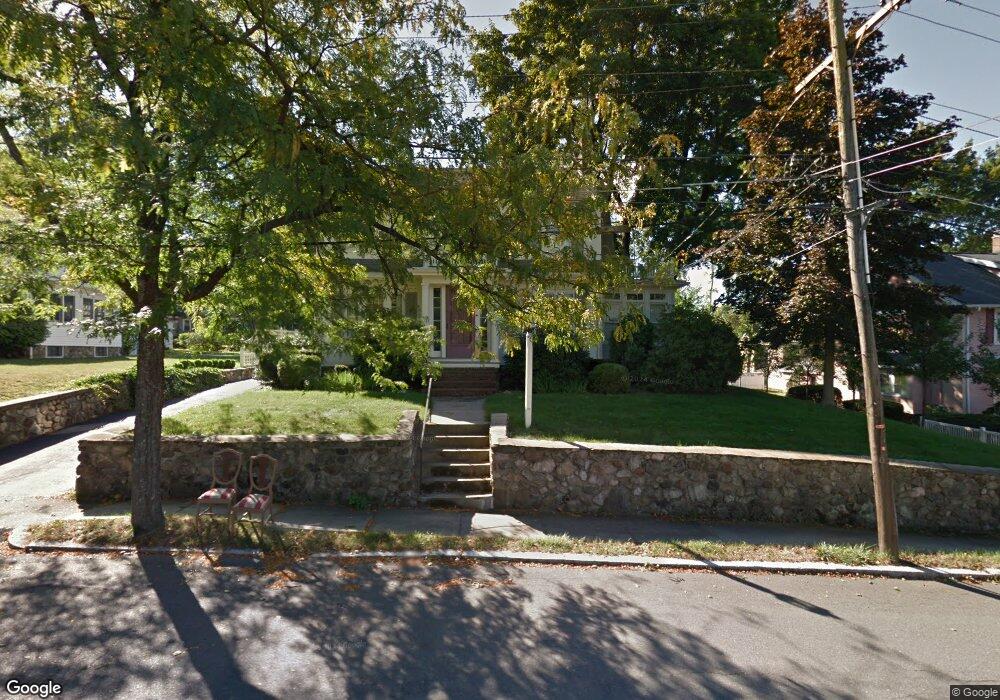
11 Aborn Ave Wakefield, MA 01880
Lakeside NeighborhoodEstimated Value: $1,017,298 - $1,489,000
3
Beds
2
Baths
2,096
Sq Ft
$561/Sq Ft
Est. Value
About This Home
This home is located at 11 Aborn Ave, Wakefield, MA 01880 and is currently estimated at $1,176,075, approximately $561 per square foot. 11 Aborn Ave is a home located in Middlesex County with nearby schools including Wakefield Memorial High School, St Joseph School, and Odyssey Day School.
Ownership History
Date
Name
Owned For
Owner Type
Purchase Details
Closed on
Jun 5, 1992
Sold by
Mcgrail Stephen J and Mcgrail Virginia E
Bought by
Mcqueen Robin D and Lynch Brian E
Current Estimated Value
Home Financials for this Owner
Home Financials are based on the most recent Mortgage that was taken out on this home.
Original Mortgage
$122,500
Interest Rate
8.8%
Mortgage Type
Purchase Money Mortgage
Create a Home Valuation Report for This Property
The Home Valuation Report is an in-depth analysis detailing your home's value as well as a comparison with similar homes in the area
Home Values in the Area
Average Home Value in this Area
Purchase History
| Date | Buyer | Sale Price | Title Company |
|---|---|---|---|
| Mcqueen Robin D | $272,500 | -- |
Source: Public Records
Mortgage History
| Date | Status | Borrower | Loan Amount |
|---|---|---|---|
| Open | Mcqueen Robin D | $162,500 | |
| Closed | Mcqueen Robin D | $114,600 | |
| Closed | Mcqueen Robin D | $75,000 | |
| Closed | Mcqueen Robin D | $122,500 |
Source: Public Records
Tax History Compared to Growth
Tax History
| Year | Tax Paid | Tax Assessment Tax Assessment Total Assessment is a certain percentage of the fair market value that is determined by local assessors to be the total taxable value of land and additions on the property. | Land | Improvement |
|---|---|---|---|---|
| 2025 | $12,182 | $1,073,300 | $444,700 | $628,600 |
| 2024 | $11,359 | $1,009,700 | $418,200 | $591,500 |
| 2023 | $11,178 | $952,900 | $394,500 | $558,400 |
| 2022 | $10,681 | $867,000 | $358,700 | $508,300 |
| 2021 | $10,235 | $804,000 | $337,100 | $466,900 |
| 2020 | $9,668 | $757,100 | $317,500 | $439,600 |
| 2019 | $9,240 | $720,200 | $302,000 | $418,200 |
| 2018 | $8,895 | $686,900 | $288,000 | $398,900 |
| 2017 | $8,730 | $670,000 | $280,900 | $389,100 |
| 2016 | $8,314 | $616,300 | $278,800 | $337,500 |
| 2015 | $7,996 | $593,200 | $268,300 | $324,900 |
| 2014 | $7,434 | $581,700 | $263,000 | $318,700 |
Source: Public Records
Map
Nearby Homes