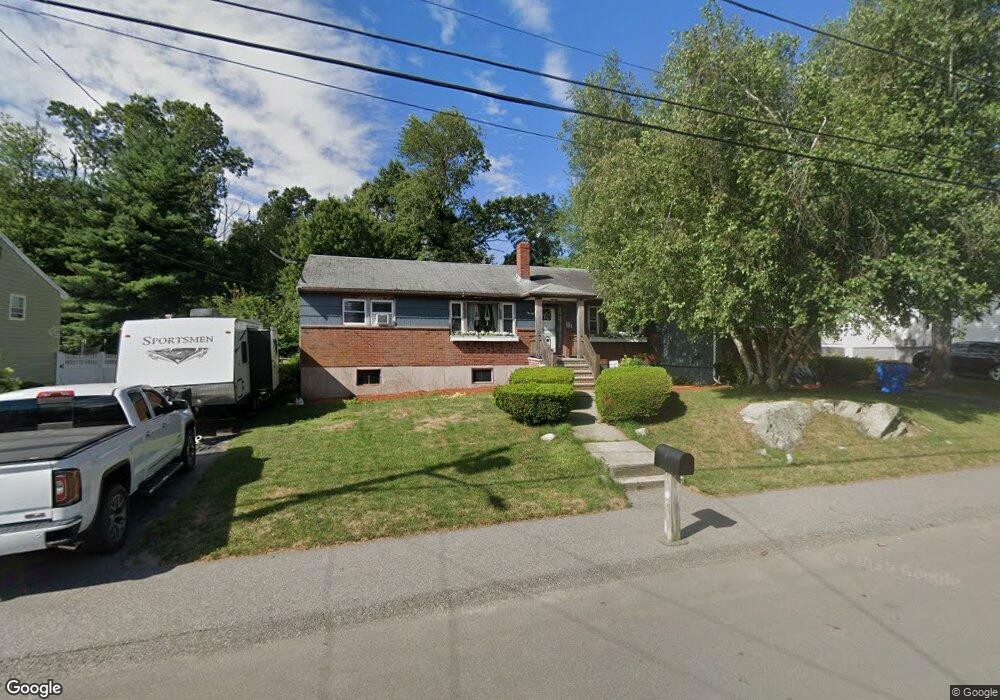
11 Acorn Dr Randolph, MA 02368
South Randolph NeighborhoodEstimated Value: $599,000 - $835,000
4
Beds
2
Baths
1,992
Sq Ft
$366/Sq Ft
Est. Value
About This Home
This home is located at 11 Acorn Dr, Randolph, MA 02368 and is currently estimated at $728,706, approximately $365 per square foot. 11 Acorn Dr is a home located in Norfolk County with nearby schools including Randolph High School and Lighthouse Baptist Christian Academy.
Ownership History
Date
Name
Owned For
Owner Type
Purchase Details
Closed on
Mar 18, 2025
Sold by
Macdonald Timothy A
Bought by
Macodnald Ft and Macdonald
Current Estimated Value
Purchase Details
Closed on
Oct 14, 2022
Sold by
Macdonald Judith A Est
Bought by
Macdonald Timothy A
Purchase Details
Closed on
Feb 21, 1978
Bought by
Macdonald Judith A and Burke Claire E
Create a Home Valuation Report for This Property
The Home Valuation Report is an in-depth analysis detailing your home's value as well as a comparison with similar homes in the area
Home Values in the Area
Average Home Value in this Area
Purchase History
| Date | Buyer | Sale Price | Title Company |
|---|---|---|---|
| Macodnald Ft | -- | None Available | |
| Macodnald Ft | -- | None Available | |
| Macdonald Timothy A | -- | None Available | |
| Macdonald Timothy A | -- | None Available | |
| Macdonald Judith A | -- | -- |
Source: Public Records
Tax History Compared to Growth
Tax History
| Year | Tax Paid | Tax Assessment Tax Assessment Total Assessment is a certain percentage of the fair market value that is determined by local assessors to be the total taxable value of land and additions on the property. | Land | Improvement |
|---|---|---|---|---|
| 2025 | $7,454 | $642,000 | $241,800 | $400,200 |
| 2024 | $6,888 | $601,600 | $237,200 | $364,400 |
| 2023 | $6,414 | $531,000 | $215,600 | $315,400 |
| 2022 | $6,558 | $482,200 | $179,700 | $302,500 |
| 2021 | $6,926 | $468,600 | $149,700 | $318,900 |
| 2020 | $6,605 | $443,000 | $149,700 | $293,300 |
| 2019 | $6,229 | $415,800 | $142,600 | $273,200 |
| 2018 | $5,569 | $350,700 | $132,100 | $218,600 |
| 2017 | $5,657 | $349,600 | $125,800 | $223,800 |
| 2016 | $5,212 | $299,700 | $114,300 | $185,400 |
| 2015 | $4,929 | $272,300 | $108,800 | $163,500 |
Source: Public Records
Map
Nearby Homes