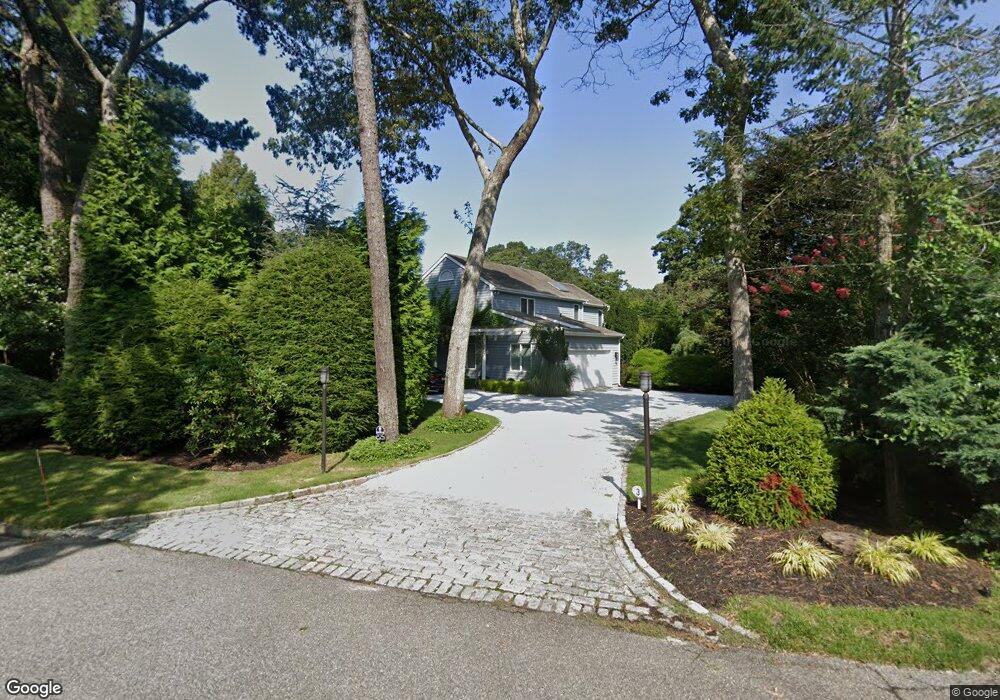
11 Acorn Path East Quogue, NY 11942
Estimated Value: $1,175,000 - $1,313,000
4
Beds
2
Baths
2,100
Sq Ft
$585/Sq Ft
Est. Value
About This Home
This home is located at 11 Acorn Path, East Quogue, NY 11942 and is currently estimated at $1,227,967, approximately $584 per square foot. 11 Acorn Path is a home located in Suffolk County.
Ownership History
Date
Name
Owned For
Owner Type
Purchase Details
Closed on
Jul 27, 2016
Sold by
11 Acorn Path Inc
Bought by
Baglio Michael
Current Estimated Value
Home Financials for this Owner
Home Financials are based on the most recent Mortgage that was taken out on this home.
Original Mortgage
$500,000
Outstanding Balance
$398,038
Interest Rate
3.41%
Mortgage Type
New Conventional
Estimated Equity
$829,929
Purchase Details
Closed on
Jul 1, 2015
Sold by
Beck Rose Ann
Bought by
11 Acorn Path Inc
Purchase Details
Closed on
Jul 16, 2014
Sold by
Dobbeck Rose Ann
Bought by
Dobbeck Rose Ann
Purchase Details
Closed on
Sep 25, 2001
Sold by
Blydenburgh James C and Blydenburgh Patricia
Bought by
Argenti Michael P
Home Financials for this Owner
Home Financials are based on the most recent Mortgage that was taken out on this home.
Original Mortgage
$150,000
Interest Rate
6.92%
Create a Home Valuation Report for This Property
The Home Valuation Report is an in-depth analysis detailing your home's value as well as a comparison with similar homes in the area
Home Values in the Area
Average Home Value in this Area
Purchase History
| Date | Buyer | Sale Price | Title Company |
|---|---|---|---|
| Baglio Michael | $625,000 | None Available | |
| 11 Acorn Path Inc | -- | None Available | |
| Dobbeck Rose Ann | -- | -- | |
| Argenti Michael P | $340,000 | Fidelity National Title Ins |
Source: Public Records
Mortgage History
| Date | Status | Borrower | Loan Amount |
|---|---|---|---|
| Open | Baglio Michael | $500,000 | |
| Previous Owner | Argenti Michael P | $150,000 |
Source: Public Records
Tax History Compared to Growth
Tax History
| Year | Tax Paid | Tax Assessment Tax Assessment Total Assessment is a certain percentage of the fair market value that is determined by local assessors to be the total taxable value of land and additions on the property. | Land | Improvement |
|---|---|---|---|---|
| 2024 | $9,904 | $725,300 | $319,300 | $406,000 |
| 2023 | $9,904 | $725,300 | $319,300 | $406,000 |
| 2022 | $10,068 | $725,300 | $319,300 | $406,000 |
| 2021 | $10,068 | $680,000 | $274,000 | $406,000 |
| 2020 | $9,285 | $725,300 | $319,300 | $406,000 |
| 2019 | $9,285 | $0 | $0 | $0 |
| 2018 | -- | $605,400 | $287,400 | $318,000 |
| 2017 | $8,640 | $605,400 | $287,400 | $318,000 |
| 2016 | $6,927 | $486,200 | $287,400 | $198,800 |
| 2015 | -- | $486,200 | $287,400 | $198,800 |
| 2014 | -- | $486,200 | $287,400 | $198,800 |
Source: Public Records
Map
Nearby Homes
- 16 Squires Ave
- 15 Osprey Ave
- 44 Eisenhower Dr
- 15 Indian Run
- 3 Willow Shade Ave
- 5 Canvasback Ln
- 22 Shinnecock Ave
- 12 Landing Ln
- 4 Bonita Rd
- 39 Sherwood Rd
- 50 Sherwood Rd
- 30 Sandpiper Ln
- 4 Pine Tree Ct
- 24 Canvasback Ln
- 33 Landing Ln
- 26 Canvasback Ln
- 21 Tarpon Rd
- 89 Bellows Terrace
- 12 Shinnecock Rd
- 9 Shinnecock Rd