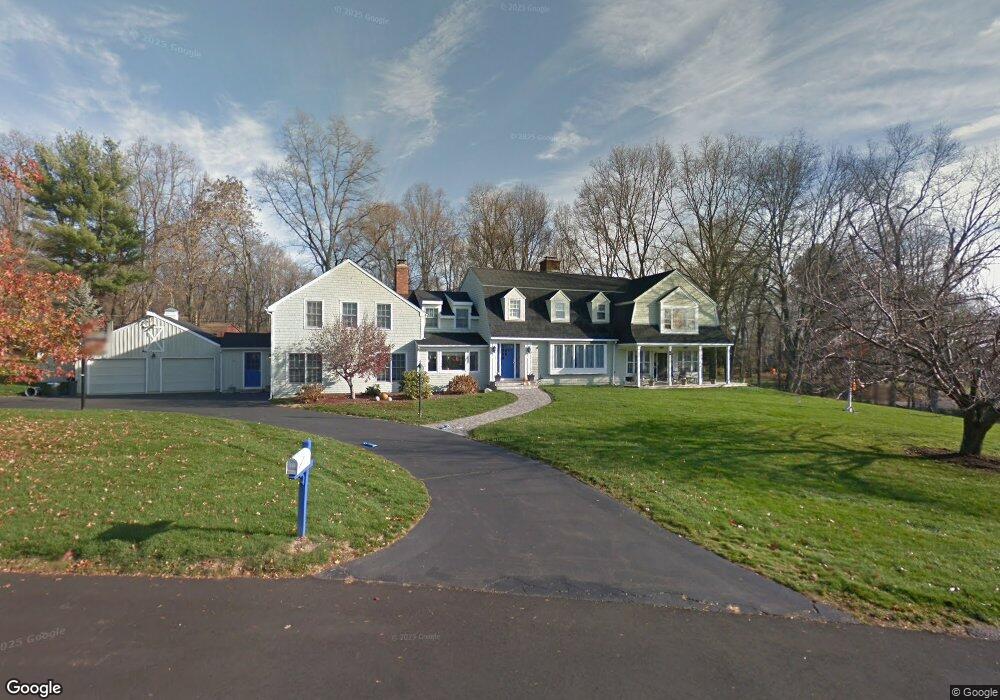
11 Adams Farm Rd Westport, CT 06880
Staples NeighborhoodEstimated Value: $1,779,000 - $3,047,000
5
Beds
5
Baths
5,512
Sq Ft
$481/Sq Ft
Est. Value
About This Home
This home is located at 11 Adams Farm Rd, Westport, CT 06880 and is currently estimated at $2,651,575, approximately $481 per square foot. 11 Adams Farm Rd is a home located in Fairfield County with nearby schools including Long Lots School, Bedford Middle School, and Staples High School.
Ownership History
Date
Name
Owned For
Owner Type
Purchase Details
Closed on
Jul 26, 2018
Sold by
Feinberg Robbi S
Bought by
Robbi Feinberg Ret
Current Estimated Value
Purchase Details
Closed on
Sep 15, 1989
Sold by
Garlick Muriel
Bought by
Feinberg Robert B
Create a Home Valuation Report for This Property
The Home Valuation Report is an in-depth analysis detailing your home's value as well as a comparison with similar homes in the area
Home Values in the Area
Average Home Value in this Area
Purchase History
| Date | Buyer | Sale Price | Title Company |
|---|---|---|---|
| Robbi Feinberg Ret | -- | -- | |
| Robbi Feinberg Ret | -- | -- | |
| Feinberg Robert B | $435,000 | -- |
Source: Public Records
Mortgage History
| Date | Status | Borrower | Loan Amount |
|---|---|---|---|
| Previous Owner | Feinberg Robert B | $500,000 | |
| Previous Owner | Feinberg Robert B | $400,000 | |
| Previous Owner | Feinberg Robert B | $200,000 | |
| Previous Owner | Feinberg Robert B | $357,550 |
Source: Public Records
Tax History Compared to Growth
Tax History
| Year | Tax Paid | Tax Assessment Tax Assessment Total Assessment is a certain percentage of the fair market value that is determined by local assessors to be the total taxable value of land and additions on the property. | Land | Improvement |
|---|---|---|---|---|
| 2025 | $21,263 | $1,127,400 | $453,600 | $673,800 |
| 2024 | $20,992 | $1,127,400 | $453,600 | $673,800 |
| 2023 | $20,688 | $1,127,400 | $453,600 | $673,800 |
| 2022 | $20,372 | $1,127,400 | $453,600 | $673,800 |
| 2021 | $7,774 | $1,127,400 | $453,600 | $673,800 |
| 2020 | $12,673 | $1,246,600 | $478,800 | $767,800 |
| 2019 | $20,807 | $1,234,100 | $478,800 | $755,300 |
| 2018 | $9,911 | $1,234,100 | $478,800 | $755,300 |
| 2017 | $7,288 | $1,234,100 | $478,800 | $755,300 |
| 2016 | $20,807 | $1,234,100 | $478,800 | $755,300 |
| 2015 | $19,881 | $1,099,000 | $395,600 | $703,400 |
| 2014 | $19,716 | $1,099,000 | $395,600 | $703,400 |
Source: Public Records
Map
Nearby Homes
- 16 Burr School Rd
- 14 Burr School Rd
- 4 Burr Farms Rd
- 9 Burr Farms Rd
- 5 Willow Walk
- 7 Morningside Ln
- 13 Terhune Dr
- 40 Maple Ave N
- 20 Morningside Dr S
- 21 Sturges Commons
- 22 Morningside Dr S
- 10 Debra Ln
- 6 Bayberry Common
- 185 Regents Park
- 107 Old Rd
- 6 Fox Run Ln
- 116 Roseville Rd
- 1 Coastal Ct
- 1 Sturges Hwy Unit Lot 1
- 1 Sturges Hwy Unit 2