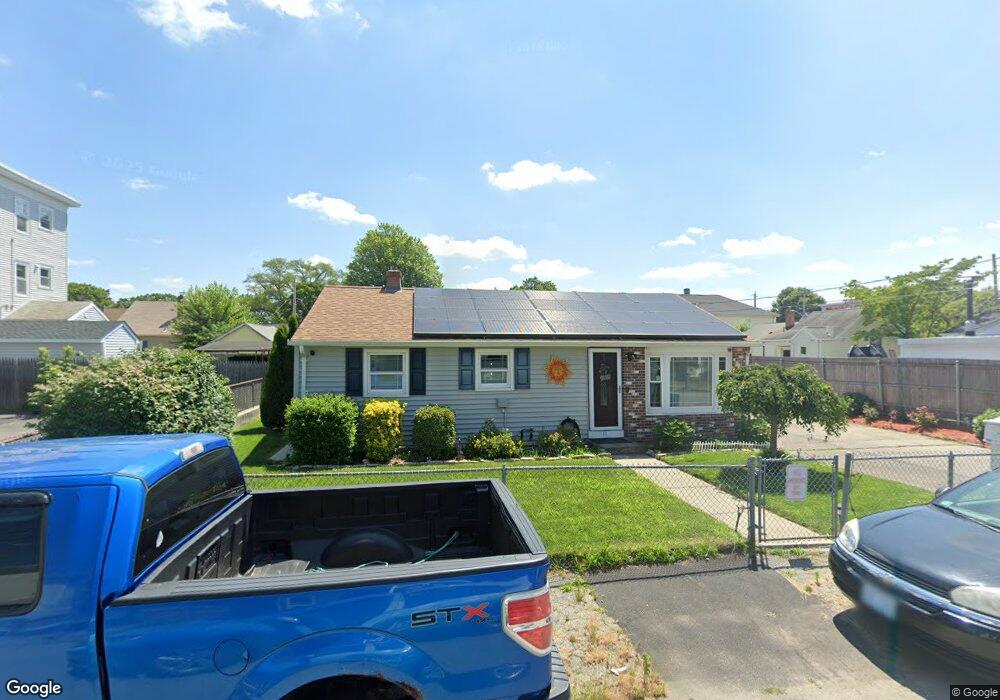
11 Adin St Pawtucket, RI 02861
Darlington NeighborhoodEstimated Value: $346,000 - $381,000
3
Beds
1
Bath
936
Sq Ft
$389/Sq Ft
Est. Value
About This Home
This home is located at 11 Adin St, Pawtucket, RI 02861 and is currently estimated at $364,278, approximately $389 per square foot. 11 Adin St is a home located in Providence County with nearby schools including St Cecilia School.
Ownership History
Date
Name
Owned For
Owner Type
Purchase Details
Closed on
Jul 24, 2017
Sold by
Pavao Fatima N
Bought by
Wilson Sally A and Wilson William P
Current Estimated Value
Purchase Details
Closed on
Jul 17, 2012
Sold by
Nunes Antonio M and Nunes Rita
Bought by
Pavao Fatima N
Purchase Details
Closed on
Oct 8, 2009
Sold by
Pavao Antonio M and Pavao Fatima N
Bought by
Nunes Antonio M and Nunes Rita
Purchase Details
Closed on
Jan 12, 1996
Sold by
Pavao Conceicao
Bought by
Pavao Antonio M and Pavao Fatima
Home Financials for this Owner
Home Financials are based on the most recent Mortgage that was taken out on this home.
Original Mortgage
$85,450
Interest Rate
7.31%
Create a Home Valuation Report for This Property
The Home Valuation Report is an in-depth analysis detailing your home's value as well as a comparison with similar homes in the area
Home Values in the Area
Average Home Value in this Area
Purchase History
| Date | Buyer | Sale Price | Title Company |
|---|---|---|---|
| Wilson Sally A | $25,000 | -- | |
| Pavao Fatima N | -- | -- | |
| Nunes Antonio M | -- | -- | |
| Pavao Antonio M | $90,000 | -- |
Source: Public Records
Mortgage History
| Date | Status | Borrower | Loan Amount |
|---|---|---|---|
| Previous Owner | Pavao Antonio M | $85,450 |
Source: Public Records
Tax History Compared to Growth
Tax History
| Year | Tax Paid | Tax Assessment Tax Assessment Total Assessment is a certain percentage of the fair market value that is determined by local assessors to be the total taxable value of land and additions on the property. | Land | Improvement |
|---|---|---|---|---|
| 2025 | $3,975 | $302,300 | $125,800 | $176,500 |
| 2024 | $3,730 | $302,300 | $125,800 | $176,500 |
| 2023 | $3,781 | $223,200 | $78,700 | $144,500 |
| 2022 | $3,701 | $223,200 | $78,700 | $144,500 |
| 2021 | $3,701 | $223,200 | $78,700 | $144,500 |
| 2020 | $3,319 | $158,900 | $62,100 | $96,800 |
| 2019 | $3,319 | $158,900 | $62,100 | $96,800 |
| 2018 | $3,199 | $158,900 | $62,100 | $96,800 |
| 2017 | $3,113 | $137,000 | $51,500 | $85,500 |
| 2016 | $2,999 | $137,000 | $51,500 | $85,500 |
| 2015 | $2,999 | $137,000 | $51,500 | $85,500 |
| 2014 | $2,885 | $125,100 | $51,500 | $73,600 |
Source: Public Records
Map
Nearby Homes