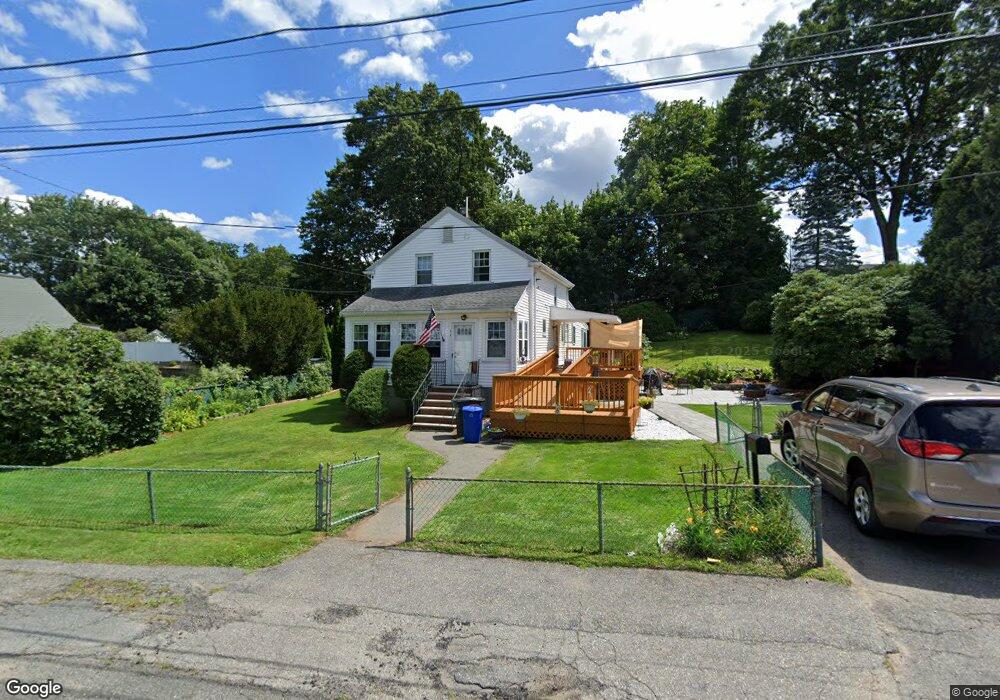
11 Albert St Unit 1 Woburn, MA 01801
Mishawum NeighborhoodEstimated Value: $747,460 - $863,000
4
Beds
2
Baths
1,668
Sq Ft
$492/Sq Ft
Est. Value
About This Home
This home is located at 11 Albert St Unit 1, Woburn, MA 01801 and is currently estimated at $819,865, approximately $491 per square foot. 11 Albert St Unit 1 is a home located in Middlesex County with nearby schools including Malcolm White Elementary School, John F. Kennedy Middle School, and Woburn High School.
Ownership History
Date
Name
Owned For
Owner Type
Purchase Details
Closed on
Mar 27, 2023
Sold by
Evans Mary C
Bought by
Mary C Evans T C and Mary Evans
Current Estimated Value
Purchase Details
Closed on
Sep 2, 2011
Sold by
Matthews Nancy J
Bought by
Nancy J Matthews T J and Nancy Matthews
Create a Home Valuation Report for This Property
The Home Valuation Report is an in-depth analysis detailing your home's value as well as a comparison with similar homes in the area
Home Values in the Area
Average Home Value in this Area
Purchase History
| Date | Buyer | Sale Price | Title Company |
|---|---|---|---|
| Mary C Evans T C | -- | None Available | |
| Mary C Evans T | -- | None Available | |
| Nancy J Matthews T J | -- | -- | |
| Nancy J Matthews T | -- | -- |
Source: Public Records
Mortgage History
| Date | Status | Borrower | Loan Amount |
|---|---|---|---|
| Previous Owner | Nancy J Matthews T J | $50,000 |
Source: Public Records
Tax History Compared to Growth
Tax History
| Year | Tax Paid | Tax Assessment Tax Assessment Total Assessment is a certain percentage of the fair market value that is determined by local assessors to be the total taxable value of land and additions on the property. | Land | Improvement |
|---|---|---|---|---|
| 2025 | $5,553 | $650,200 | $307,000 | $343,200 |
| 2024 | $4,934 | $612,100 | $292,300 | $319,800 |
| 2023 | $4,973 | $571,600 | $265,800 | $305,800 |
| 2022 | $4,781 | $511,900 | $231,100 | $280,800 |
| 2021 | $4,382 | $469,700 | $220,100 | $249,600 |
| 2020 | $4,364 | $468,200 | $220,100 | $248,100 |
| 2019 | $4,288 | $451,400 | $209,700 | $241,700 |
| 2018 | $4,014 | $405,900 | $192,400 | $213,500 |
| 2017 | $6,943 | $382,600 | $183,200 | $199,400 |
| 2016 | $3,630 | $361,200 | $171,200 | $190,000 |
| 2015 | $3,495 | $343,700 | $160,000 | $183,700 |
| 2014 | $3,391 | $324,800 | $160,000 | $164,800 |
Source: Public Records
Map
Nearby Homes
- 74 Beach St Unit 6-12
- 74 Beach St Unit 3
- 52 Middle St
- 38 Middle St
- 0 Fryeburg Rd
- 3 Highet Ave
- 12 Mishawum Rd
- 295 Salem St Unit 69
- 1 Boline Place
- 8 Clinton St
- 602 Main St Unit 1
- 14 Church Ave
- 14 Church Ave Unit 2
- 18 Carmen Terrace
- 9 Wade Ave
- 18 Gardner Ave
- 2 Eastern Ave
- 6 Callahan Dr
- 166 Place Ln Unit 166
- 168 Place Ln