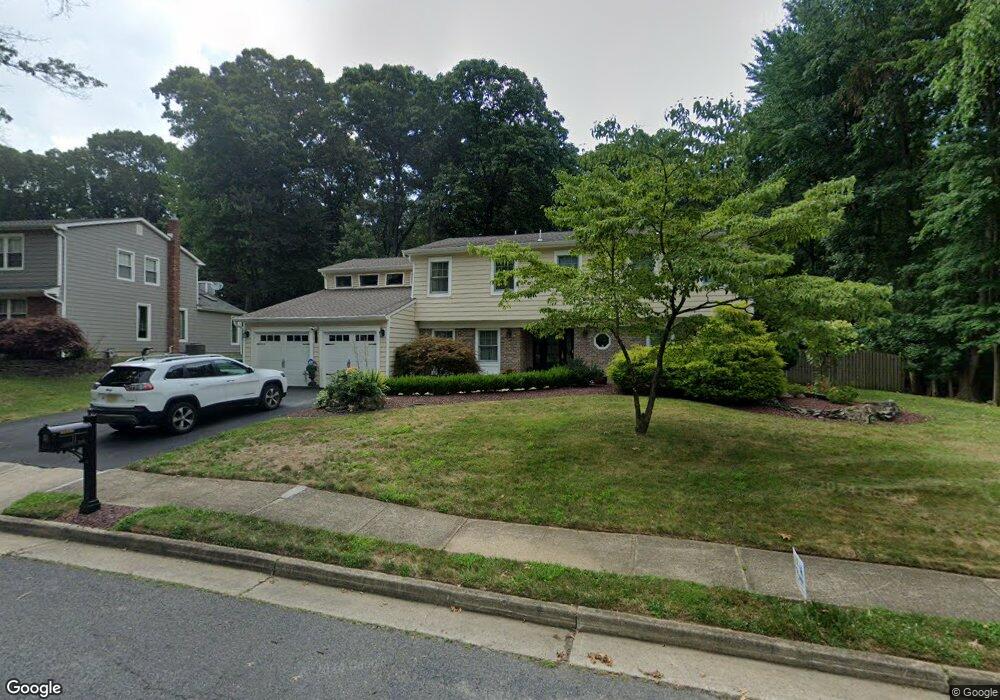
11 Algonquin Dr Marlboro, NJ 07746
Estimated Value: $859,880 - $1,044,000
4
Beds
3
Baths
3,075
Sq Ft
$318/Sq Ft
Est. Value
About This Home
This home is located at 11 Algonquin Dr, Marlboro, NJ 07746 and is currently estimated at $977,970, approximately $318 per square foot. 11 Algonquin Dr is a home located in Monmouth County with nearby schools including Asher Holmes Elementary School, Marlboro Middle School, and Marlboro High School.
Ownership History
Date
Name
Owned For
Owner Type
Purchase Details
Closed on
Oct 22, 2015
Sold by
Maceezek Karina and Gershgorin Philip
Bought by
Maceezek Karina
Current Estimated Value
Home Financials for this Owner
Home Financials are based on the most recent Mortgage that was taken out on this home.
Original Mortgage
$350,000
Outstanding Balance
$275,377
Interest Rate
3.88%
Mortgage Type
New Conventional
Estimated Equity
$702,593
Purchase Details
Closed on
Oct 1, 2002
Sold by
Valo John
Bought by
Maceczek Karina and Gershgorin Philip
Home Financials for this Owner
Home Financials are based on the most recent Mortgage that was taken out on this home.
Original Mortgage
$368,000
Interest Rate
6.27%
Purchase Details
Closed on
Oct 8, 1997
Sold by
Bernstein Harvey
Bought by
Valo John
Home Financials for this Owner
Home Financials are based on the most recent Mortgage that was taken out on this home.
Original Mortgage
$220,000
Interest Rate
7.23%
Create a Home Valuation Report for This Property
The Home Valuation Report is an in-depth analysis detailing your home's value as well as a comparison with similar homes in the area
Home Values in the Area
Average Home Value in this Area
Purchase History
| Date | Buyer | Sale Price | Title Company |
|---|---|---|---|
| Maceezek Karina | -- | Main Street Title Agency Inc | |
| Maceczek Karina | $460,000 | -- | |
| Valo John | $275,000 | -- |
Source: Public Records
Mortgage History
| Date | Status | Borrower | Loan Amount |
|---|---|---|---|
| Open | Maceezek Karina | $350,000 | |
| Closed | Maceczek Karina | $368,000 | |
| Previous Owner | Valo John | $220,000 |
Source: Public Records
Tax History Compared to Growth
Tax History
| Year | Tax Paid | Tax Assessment Tax Assessment Total Assessment is a certain percentage of the fair market value that is determined by local assessors to be the total taxable value of land and additions on the property. | Land | Improvement |
|---|---|---|---|---|
| 2025 | $11,672 | $468,000 | $195,200 | $272,800 |
| 2024 | $11,157 | $468,000 | $195,200 | $272,800 |
| 2023 | $11,157 | $468,000 | $195,200 | $272,800 |
| 2022 | $10,451 | $449,900 | $195,200 | $254,700 |
| 2021 | $10,348 | $449,900 | $195,200 | $254,700 |
| 2020 | $10,343 | $449,900 | $195,200 | $254,700 |
| 2019 | $10,348 | $449,900 | $195,200 | $254,700 |
| 2018 | $10,172 | $449,900 | $195,200 | $254,700 |
| 2017 | $9,974 | $449,900 | $195,200 | $254,700 |
| 2016 | $9,934 | $449,900 | $195,200 | $254,700 |
| 2015 | $9,644 | $443,400 | $195,200 | $248,200 |
| 2014 | $9,544 | $434,200 | $195,200 | $239,000 |
Source: Public Records
Map
Nearby Homes