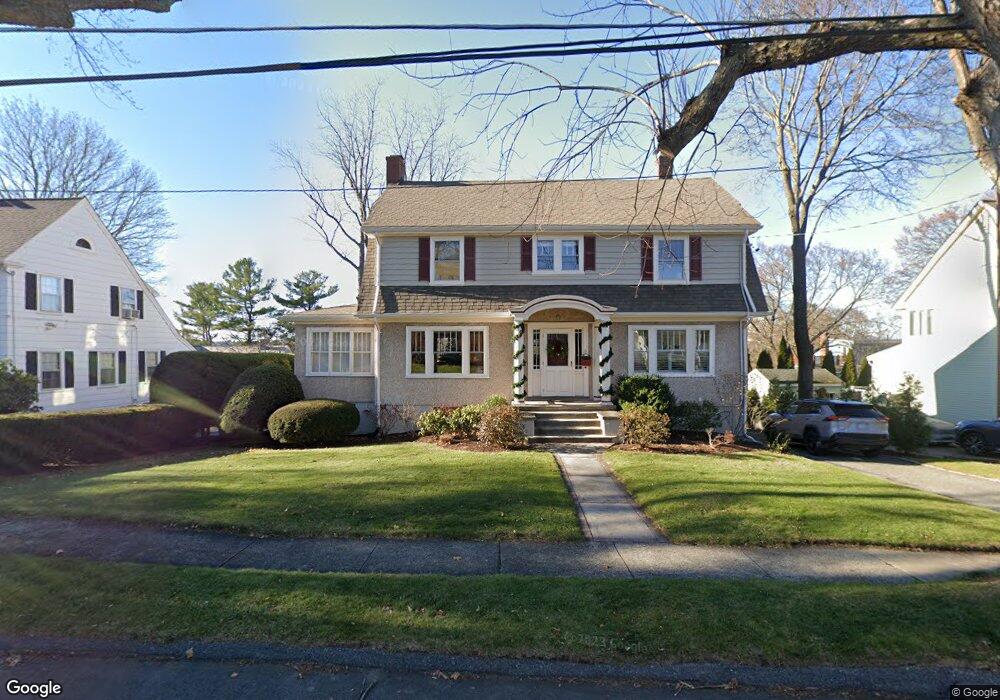
11 Allen Rd Winchester, MA 01890
Symmes Corner NeighborhoodEstimated Value: $1,520,323 - $1,832,000
5
Beds
3
Baths
2,478
Sq Ft
$687/Sq Ft
Est. Value
About This Home
This home is located at 11 Allen Rd, Winchester, MA 01890 and is currently estimated at $1,703,581, approximately $687 per square foot. 11 Allen Rd is a home located in Middlesex County with nearby schools including Lincoln Elementary School, McCall Middle School, and Winchester High School.
Ownership History
Date
Name
Owned For
Owner Type
Purchase Details
Closed on
Nov 21, 1995
Sold by
Hendrix Blair E
Bought by
Nagel Stefan and Nagel Nancy M
Current Estimated Value
Purchase Details
Closed on
Dec 15, 1992
Sold by
Leydon John P and Leydon Aurora M
Bought by
Hendrix Blair E
Create a Home Valuation Report for This Property
The Home Valuation Report is an in-depth analysis detailing your home's value as well as a comparison with similar homes in the area
Home Values in the Area
Average Home Value in this Area
Purchase History
| Date | Buyer | Sale Price | Title Company |
|---|---|---|---|
| Nagel Stefan | $369,900 | -- | |
| Hendrix Blair E | $318,000 | -- |
Source: Public Records
Mortgage History
| Date | Status | Borrower | Loan Amount |
|---|---|---|---|
| Open | Hendrix Blair E | $110,000 | |
| Closed | Hendrix Blair E | $125,000 |
Source: Public Records
Tax History Compared to Growth
Tax History
| Year | Tax Paid | Tax Assessment Tax Assessment Total Assessment is a certain percentage of the fair market value that is determined by local assessors to be the total taxable value of land and additions on the property. | Land | Improvement |
|---|---|---|---|---|
| 2025 | $154 | $1,385,800 | $875,000 | $510,800 |
| 2024 | $14,517 | $1,281,300 | $812,500 | $468,800 |
| 2023 | $13,931 | $1,180,600 | $718,700 | $461,900 |
| 2022 | $13,671 | $1,092,800 | $656,200 | $436,600 |
| 2021 | $12,618 | $983,500 | $546,900 | $436,600 |
| 2020 | $11,798 | $952,200 | $515,600 | $436,600 |
| 2019 | $10,774 | $889,700 | $453,100 | $436,600 |
| 2018 | $10,376 | $851,200 | $427,300 | $423,900 |
| 2017 | $9,834 | $800,800 | $402,300 | $398,500 |
| 2016 | $9,205 | $788,100 | $402,300 | $385,800 |
| 2015 | $8,906 | $733,600 | $365,600 | $368,000 |
| 2014 | $8,358 | $660,200 | $304,700 | $355,500 |
Source: Public Records
Map
Nearby Homes
- 446 Highland Ave
- 8 Felsdale Close
- 5 Bacon St
- 39 Town Way
- 19 Town Way
- 77A Brooks St
- 30 Prospect St
- 26 North Gateway
- 9 Lakeview Terrace
- 53 Bacon St
- 12 Canterbury Rd
- 20 Grove Place
- 263 Highland Ave
- 46 Church St
- 595 Winthrop St
- 5 Norwich Cir
- 36 Elmwood Ave Unit 2
- 545 Winthrop St Unit Lot 9
- 545 Winthrop St Unit Lot 7
- 545 Winthrop St Unit Lot D