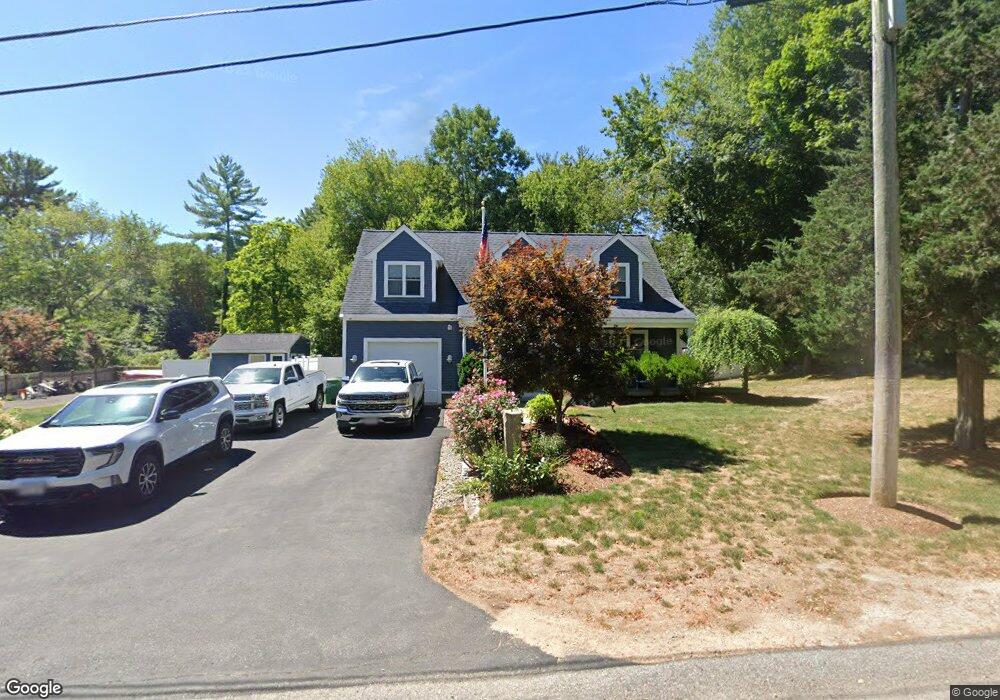
11 Allen St Pembroke, MA 02359
Estimated Value: $601,000 - $718,000
2
Beds
3
Baths
1,669
Sq Ft
$386/Sq Ft
Est. Value
About This Home
This home is located at 11 Allen St, Pembroke, MA 02359 and is currently estimated at $644,604, approximately $386 per square foot. 11 Allen St is a home with nearby schools including Pembroke High School and Cardinal Cushing Centers.
Ownership History
Date
Name
Owned For
Owner Type
Purchase Details
Closed on
Oct 8, 2013
Sold by
Tuells Corrine M
Bought by
Macpherson Scott W
Current Estimated Value
Home Financials for this Owner
Home Financials are based on the most recent Mortgage that was taken out on this home.
Original Mortgage
$137,700
Outstanding Balance
$36,535
Interest Rate
4.61%
Mortgage Type
New Conventional
Estimated Equity
$608,069
Purchase Details
Closed on
Aug 29, 2006
Sold by
Tuells Wendall L
Bought by
Tuells Wendall L and Tuells Corinne M
Create a Home Valuation Report for This Property
The Home Valuation Report is an in-depth analysis detailing your home's value as well as a comparison with similar homes in the area
Home Values in the Area
Average Home Value in this Area
Purchase History
| Date | Buyer | Sale Price | Title Company |
|---|---|---|---|
| Macpherson Scott W | $153,000 | -- | |
| Tuells Wendall L | -- | -- |
Source: Public Records
Mortgage History
| Date | Status | Borrower | Loan Amount |
|---|---|---|---|
| Open | Macpherson Scott W | $137,700 |
Source: Public Records
Tax History Compared to Growth
Tax History
| Year | Tax Paid | Tax Assessment Tax Assessment Total Assessment is a certain percentage of the fair market value that is determined by local assessors to be the total taxable value of land and additions on the property. | Land | Improvement |
|---|---|---|---|---|
| 2025 | $6,391 | $531,700 | $273,100 | $258,600 |
| 2024 | $6,057 | $503,500 | $247,400 | $256,100 |
| 2023 | $5,860 | $460,700 | $227,000 | $233,700 |
| 2022 | $5,632 | $398,000 | $189,700 | $208,300 |
| 2021 | $5,451 | $373,900 | $181,500 | $192,400 |
| 2020 | $5,369 | $370,500 | $177,500 | $193,000 |
| 2019 | $5,148 | $352,600 | $169,300 | $183,300 |
| 2018 | $5,061 | $339,900 | $158,000 | $181,900 |
| 2017 | $5,013 | $332,000 | $150,100 | $181,900 |
| 2016 | $4,874 | $319,400 | $140,300 | $179,100 |
| 2015 | $3,342 | $226,700 | $134,300 | $92,400 |
Source: Public Records
Map
Nearby Homes
- 204 Center St Unit 9
- 100 Fairwood Dr
- 10 Warren Terrace
- 53 Grove St
- 29 Liberty Dr Unit 29
- 26 Pierce Dr
- 136 W Elm St
- 18 Wampatuck St
- 33 Barker Square Dr Unit 33
- 40 Brisan Way
- 78 Old Cart Path Ln Unit Lot 3
- 77 Old Cart Path Ln Unit Lot 4
- 72 Old Cart Path Ln Unit Lot 2
- 299 Center St
- 30 Old Washington St Unit 9
- 285 W Elm St
- 7 Farmside Dr
- 261 Washington St
- 99 Old Washington St
- 8 Pinehurst Ave