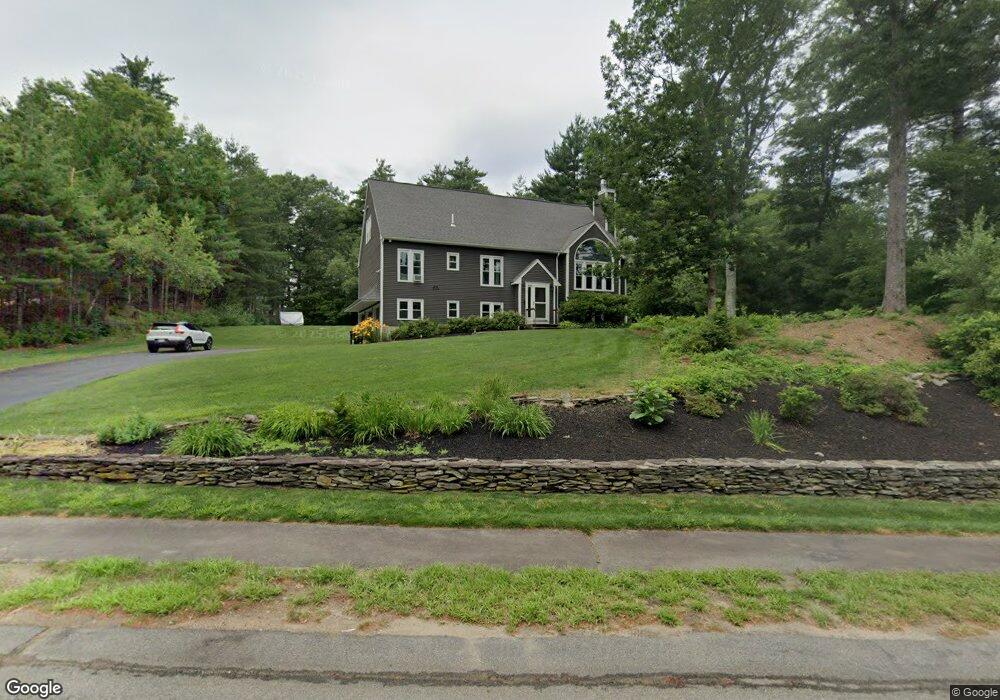
11 Alpine Run Rd Kingston, MA 02364
Estimated Value: $748,000 - $858,000
4
Beds
3
Baths
3,000
Sq Ft
$267/Sq Ft
Est. Value
About This Home
This home is located at 11 Alpine Run Rd, Kingston, MA 02364 and is currently estimated at $800,100, approximately $266 per square foot. 11 Alpine Run Rd is a home located in Plymouth County with nearby schools including Kingston Elementary School, Silver Lake Regional High School, and Kingston Intermediate School.
Ownership History
Date
Name
Owned For
Owner Type
Purchase Details
Closed on
Aug 7, 2012
Sold by
Andreson Gabriel J
Bought by
Andreson Gabriel J and Andreson Sonia C
Current Estimated Value
Purchase Details
Closed on
Nov 24, 2010
Sold by
Andreson Gabriel J and Andreson Alicia A
Bought by
Andreson Gabriel J
Purchase Details
Closed on
Mar 19, 2004
Sold by
Bennett Michael J
Bought by
Andreson Gabriel J and Andreson Alicia A
Purchase Details
Closed on
Apr 2, 2001
Sold by
Caswell Herbert H and Brault Solange
Bought by
Bennett Michael J
Purchase Details
Closed on
Aug 7, 1997
Sold by
Gharavi-Naii Jabel V and Gharavi-Naini Abdol
Bought by
Caswell Herbert H and Brault Solace
Purchase Details
Closed on
Sep 3, 1991
Sold by
Goscon Inc
Bought by
Humfryes Brant E and Humfryes Jennifer L
Purchase Details
Closed on
Jul 10, 1991
Sold by
South Shore Holdings
Bought by
Goscon Inc
Create a Home Valuation Report for This Property
The Home Valuation Report is an in-depth analysis detailing your home's value as well as a comparison with similar homes in the area
Home Values in the Area
Average Home Value in this Area
Purchase History
| Date | Buyer | Sale Price | Title Company |
|---|---|---|---|
| Andreson Gabriel J | -- | -- | |
| Andreson Gabriel J | -- | -- | |
| Andreson Gabriel J | $435,050 | -- | |
| Bennett Michael J | $330,000 | -- | |
| Caswell Herbert H | $244,000 | -- | |
| Humfryes Brant E | $114,900 | -- | |
| Goscon Inc | $45,000 | -- |
Source: Public Records
Mortgage History
| Date | Status | Borrower | Loan Amount |
|---|---|---|---|
| Previous Owner | Goscon Inc | $84,000 |
Source: Public Records
Tax History
| Year | Tax Paid | Tax Assessment Tax Assessment Total Assessment is a certain percentage of the fair market value that is determined by local assessors to be the total taxable value of land and additions on the property. | Land | Improvement |
|---|---|---|---|---|
| 2025 | $8,619 | $664,500 | $217,700 | $446,800 |
| 2024 | $7,377 | $580,400 | $189,300 | $391,100 |
| 2023 | $7,299 | $546,300 | $189,300 | $357,000 |
| 2022 | $7,309 | $501,300 | $172,100 | $329,200 |
| 2021 | $6,463 | $401,900 | $172,100 | $229,800 |
| 2020 | $11,492 | $408,100 | $172,100 | $236,000 |
| 2019 | $6,717 | $408,100 | $172,100 | $236,000 |
| 2018 | $6,055 | $368,100 | $172,100 | $196,000 |
| 2017 | $5,940 | $360,000 | $164,600 | $195,400 |
| 2016 | $6,151 | $349,300 | $150,600 | $198,700 |
| 2015 | $5,917 | $349,300 | $150,600 | $198,700 |
| 2014 | $5,723 | $343,100 | $150,600 | $192,500 |
Source: Public Records
Map
Nearby Homes
- 42 Christmas Tree Ln
- 0 Spring St
- 6 Twin Pines Ln Unit 6
- 103 Esta Rd
- 61 Esta Rd
- 241 Carver Rd Unit 7
- 14 Mariner's Way Unit 14
- 44 Mariner's Way Unit 44
- 51 Mariner's Way Unit 51
- 19 Roosevelt Rd
- 2 Mariner's Way Unit 306
- 62 Mariners Way Unit 305
- 62 Mariners Way Unit 301
- 1 Mariner's Way Unit 309
- 1 Mariner's Way Unit 204
- 6 Coachman Terrace
- 19 Coachman Terrace
- 1 Pinehurst Dr
- 44 Meeting House Rd
- 13 Pond View Way
- 14 Bavarian Way
- 15 Alpine Run Rd
- 7 Alpine Run Rd
- 12 Alpine Run Rd
- 18 Bavarian Way
- 8 Alpine Run Rd
- 10 Bavarian Way
- 16 Alpine Run Rd
- 3 Alpine Run Rd
- 19 Alpine Run Rd
- 4 Alpine Run Rd
- 13 Bavarian Way
- 22 Bavarian Way
- 6 Bavarian Way
- 20 Alpine Run Rd
- 17 Bavarian Way
- 7 Innsbruck Ln
- 23 Alpine Run Rd
- 5 Bavarian Way
- 139 Parting Ways Rd
Your Personal Tour Guide
Ask me questions while you tour the home.