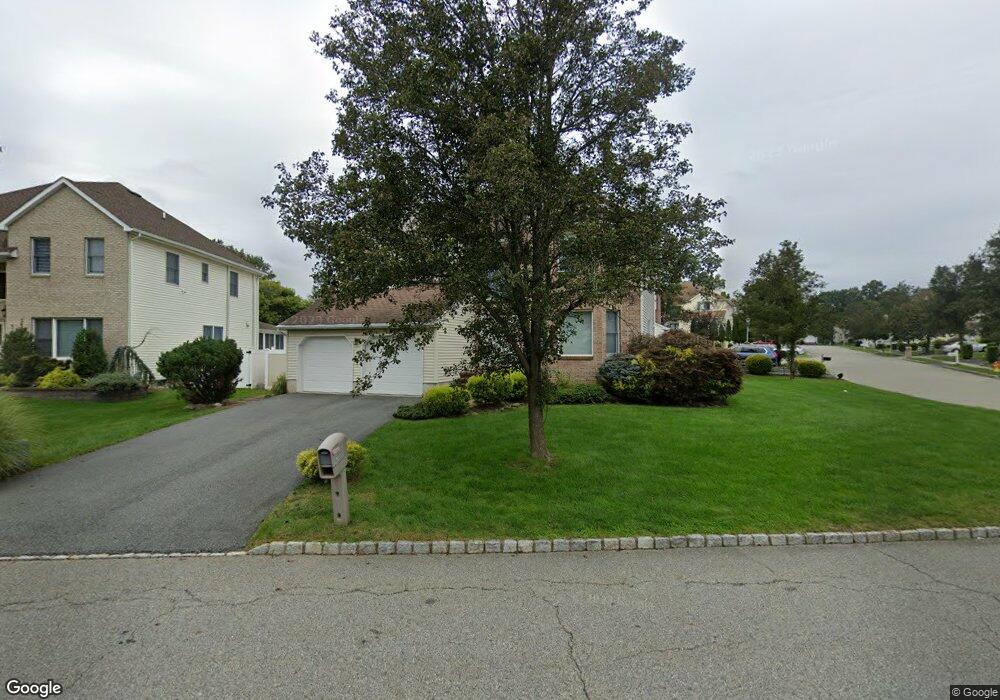
11 Amory Ct Parsippany, NJ 07054
Estimated Value: $871,000 - $1,092,000
--
Bed
--
Bath
2,593
Sq Ft
$369/Sq Ft
Est. Value
About This Home
This home is located at 11 Amory Ct, Parsippany, NJ 07054 and is currently estimated at $957,397, approximately $369 per square foot. 11 Amory Ct is a home located in Morris County with nearby schools including Northvail Elementary School, Central Middle School, and Parsippany High School.
Ownership History
Date
Name
Owned For
Owner Type
Purchase Details
Closed on
Apr 10, 2003
Sold by
Mobility Cendant
Bought by
Tan Kevin and Tan Wendy
Current Estimated Value
Home Financials for this Owner
Home Financials are based on the most recent Mortgage that was taken out on this home.
Original Mortgage
$250,000
Outstanding Balance
$108,108
Interest Rate
5.84%
Estimated Equity
$849,289
Purchase Details
Closed on
Mar 1, 2003
Sold by
Orrok Peter
Bought by
Mobility Cendant
Home Financials for this Owner
Home Financials are based on the most recent Mortgage that was taken out on this home.
Original Mortgage
$250,000
Outstanding Balance
$108,108
Interest Rate
5.84%
Estimated Equity
$849,289
Purchase Details
Closed on
May 21, 1999
Sold by
Forge Developers Llc
Bought by
Orrok Peter G and Orrok Joyce
Home Financials for this Owner
Home Financials are based on the most recent Mortgage that was taken out on this home.
Original Mortgage
$227,000
Interest Rate
6.85%
Mortgage Type
Stand Alone First
Create a Home Valuation Report for This Property
The Home Valuation Report is an in-depth analysis detailing your home's value as well as a comparison with similar homes in the area
Home Values in the Area
Average Home Value in this Area
Purchase History
| Date | Buyer | Sale Price | Title Company |
|---|---|---|---|
| Tan Kevin | $506,800 | -- | |
| Mobility Cendant | $506,800 | -- | |
| Orrok Peter G | $300,000 | -- |
Source: Public Records
Mortgage History
| Date | Status | Borrower | Loan Amount |
|---|---|---|---|
| Open | Tan Kevin | $250,000 | |
| Previous Owner | Orrok Peter G | $227,000 |
Source: Public Records
Tax History Compared to Growth
Tax History
| Year | Tax Paid | Tax Assessment Tax Assessment Total Assessment is a certain percentage of the fair market value that is determined by local assessors to be the total taxable value of land and additions on the property. | Land | Improvement |
|---|---|---|---|---|
| 2025 | $15,444 | $438,000 | $155,200 | $282,800 |
| 2024 | $15,155 | $438,000 | $155,200 | $282,800 |
| 2023 | $15,155 | $438,000 | $155,200 | $282,800 |
| 2022 | $13,529 | $438,000 | $155,200 | $282,800 |
| 2021 | $13,529 | $438,000 | $155,200 | $282,800 |
| 2020 | $13,836 | $438,000 | $155,200 | $282,800 |
| 2019 | $13,451 | $438,000 | $155,200 | $282,800 |
| 2018 | $13,153 | $438,000 | $155,200 | $282,800 |
| 2017 | $12,842 | $438,000 | $155,200 | $282,800 |
| 2016 | $12,610 | $438,000 | $155,200 | $282,800 |
| 2015 | $12,290 | $438,000 | $155,200 | $282,800 |
| 2014 | $12,119 | $438,000 | $155,200 | $282,800 |
Source: Public Records
Map
Nearby Homes
- 209 Raymound Blvd
- 159 Ball Ave
- 96 Ball Ave
- 193 Crown Point Rd Unit 193
- 89 Schindler Ct
- 72 Schindler Ct
- 53 Gordon Cir Unit 53
- 144 Jillian Blvd
- 8 Deauville Dr
- 74 Preston Rd
- 3 Woodhaven Rd
- 5 Twin Oaks Ct
- 2 Dunkirk Dr
- 18 Stafford Terrace
- 169 Knoll Rd
- 16 Nantes Rd
- 2 Buckingham Rd
- 188 Edwards Rd
- 12 Celtic Way
- 21 New England Dr