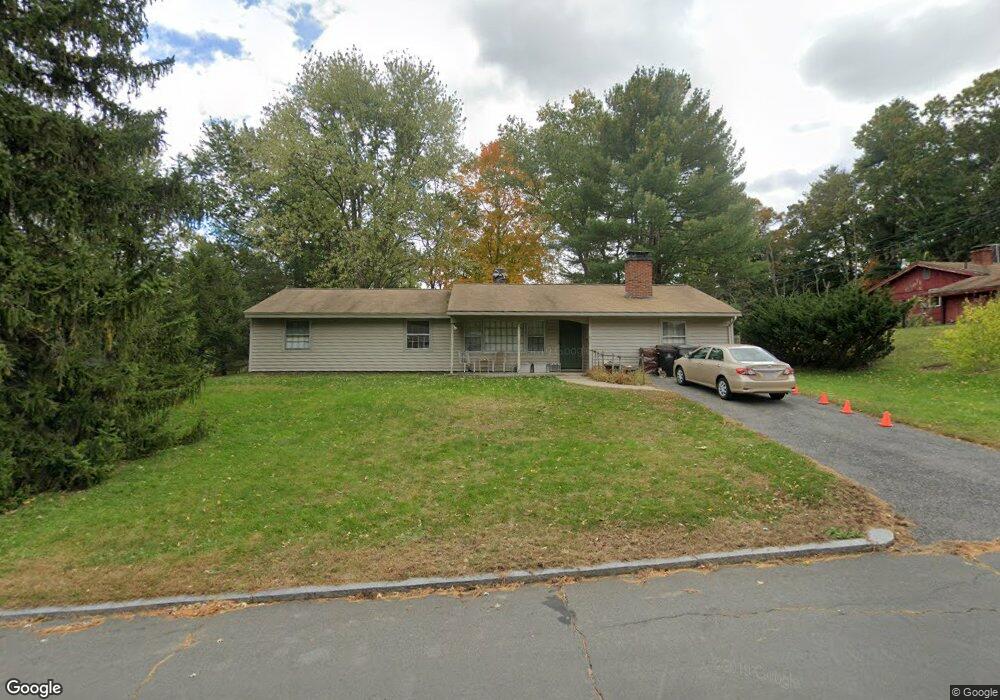
11 Amy Rd Framingham, MA 01701
Nobscot NeighborhoodEstimated Value: $596,830 - $704,000
3
Beds
2
Baths
1,560
Sq Ft
$422/Sq Ft
Est. Value
About This Home
This home is located at 11 Amy Rd, Framingham, MA 01701 and is currently estimated at $657,958, approximately $421 per square foot. 11 Amy Rd is a home located in Middlesex County with nearby schools including Framingham High School, Summit Montessori School, and Sudbury Valley School.
Ownership History
Date
Name
Owned For
Owner Type
Purchase Details
Closed on
Dec 18, 2024
Sold by
Ashley Josephine H
Bought by
Ashley Ret and Ashley
Current Estimated Value
Purchase Details
Closed on
Dec 18, 2001
Sold by
Smith Joseph H
Bought by
Ashley Joseph H
Home Financials for this Owner
Home Financials are based on the most recent Mortgage that was taken out on this home.
Original Mortgage
$200,000
Interest Rate
6.6%
Mortgage Type
Purchase Money Mortgage
Create a Home Valuation Report for This Property
The Home Valuation Report is an in-depth analysis detailing your home's value as well as a comparison with similar homes in the area
Home Values in the Area
Average Home Value in this Area
Purchase History
| Date | Buyer | Sale Price | Title Company |
|---|---|---|---|
| Ashley Ret | -- | None Available | |
| Ashley Ret | -- | None Available | |
| Ashley Ret | -- | None Available | |
| Ashley Joseph H | $250,000 | -- |
Source: Public Records
Mortgage History
| Date | Status | Borrower | Loan Amount |
|---|---|---|---|
| Previous Owner | Ashley Joseph H | $200,000 | |
| Previous Owner | Ashley Joseph H | $49,000 |
Source: Public Records
Tax History
| Year | Tax Paid | Tax Assessment Tax Assessment Total Assessment is a certain percentage of the fair market value that is determined by local assessors to be the total taxable value of land and additions on the property. | Land | Improvement |
|---|---|---|---|---|
| 2025 | $6,076 | $508,900 | $271,100 | $237,800 |
| 2024 | $5,764 | $462,600 | $242,200 | $220,400 |
| 2023 | $5,457 | $416,900 | $216,100 | $200,800 |
| 2022 | $5,153 | $375,000 | $196,100 | $178,900 |
| 2021 | $5,019 | $357,200 | $188,500 | $168,700 |
| 2020 | $5,027 | $335,600 | $171,300 | $164,300 |
| 2019 | $4,943 | $321,400 | $171,300 | $150,100 |
| 2018 | $4,811 | $294,800 | $164,900 | $129,900 |
| 2017 | $4,727 | $282,900 | $160,100 | $122,800 |
| 2016 | $4,637 | $266,800 | $160,100 | $106,700 |
| 2015 | $4,701 | $263,800 | $160,700 | $103,100 |
Source: Public Records
Map
Nearby Homes
- 32 Lyman Rd
- 484 Edgell Rd
- 5 Lavelle Ln
- 44 Agnes Dr
- 51 Woodland Dr
- 472 Brook St
- 401 Belknap Rd
- 11 Bellwood Way
- 2 Grove St
- 15 Woodmere Rd
- 2 Hemenway Rd
- 16 Bayberry Ln
- 10 Tanglewood Dr Unit 10
- 1060 Grove St Unit 31
- 1060 Grove St Unit 23
- 1060 Grove St Unit 43
- 1060 Grove St Unit 24
- 1186 Worcester Rd Unit 610
- 139 Salem End Rd
- 1321 Worcester Rd Unit 603
Your Personal Tour Guide
Ask me questions while you tour the home.