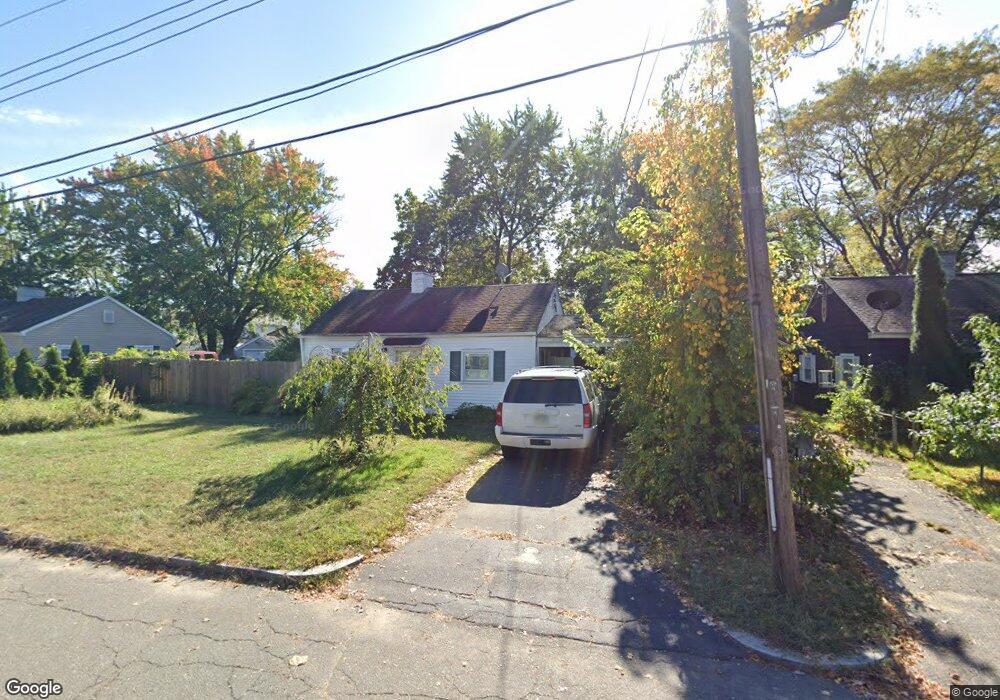
11 Ansara St Springfield, MA 01104
Liberty Heights NeighborhoodEstimated Value: $190,000 - $223,000
2
Beds
1
Bath
672
Sq Ft
$318/Sq Ft
Est. Value
About This Home
This home is located at 11 Ansara St, Springfield, MA 01104 and is currently estimated at $213,446, approximately $317 per square foot. 11 Ansara St is a home located in Hampden County with nearby schools including Mary O. Pottenger Elementary School, Van Sickle Academy, and Springfield Central High School.
Ownership History
Date
Name
Owned For
Owner Type
Purchase Details
Closed on
Sep 25, 2018
Sold by
Lenfest Carmen M and Lenfest John E
Bought by
Soto Ismael D
Current Estimated Value
Home Financials for this Owner
Home Financials are based on the most recent Mortgage that was taken out on this home.
Original Mortgage
$69,714
Outstanding Balance
$62,029
Interest Rate
5.5%
Mortgage Type
FHA
Estimated Equity
$151,417
Purchase Details
Closed on
Apr 28, 1995
Sold by
Dowling Ronald W and Dowling Jane E
Bought by
Albert Carmen M
Home Financials for this Owner
Home Financials are based on the most recent Mortgage that was taken out on this home.
Original Mortgage
$44,135
Interest Rate
8.33%
Mortgage Type
Purchase Money Mortgage
Create a Home Valuation Report for This Property
The Home Valuation Report is an in-depth analysis detailing your home's value as well as a comparison with similar homes in the area
Home Values in the Area
Average Home Value in this Area
Purchase History
| Date | Buyer | Sale Price | Title Company |
|---|---|---|---|
| Soto Ismael D | $71,000 | -- | |
| Albert Carmen M | $45,500 | -- |
Source: Public Records
Mortgage History
| Date | Status | Borrower | Loan Amount |
|---|---|---|---|
| Open | Soto Ismael D | $69,714 | |
| Previous Owner | Albert Carmen M | $44,135 |
Source: Public Records
Tax History
| Year | Tax Paid | Tax Assessment Tax Assessment Total Assessment is a certain percentage of the fair market value that is determined by local assessors to be the total taxable value of land and additions on the property. | Land | Improvement |
|---|---|---|---|---|
| 2025 | $2,739 | $174,700 | $39,200 | $135,500 |
| 2024 | $2,317 | $144,300 | $39,200 | $105,100 |
| 2023 | $2,341 | $137,300 | $34,700 | $102,600 |
| 2022 | $2,264 | $120,300 | $32,500 | $87,800 |
| 2021 | $1,822 | $96,400 | $29,500 | $66,900 |
| 2020 | $1,701 | $87,100 | $29,500 | $57,600 |
| 2019 | $1,805 | $91,700 | $32,100 | $59,600 |
| 2018 | $1,677 | $85,200 | $32,100 | $53,100 |
| 2017 | $1,661 | $84,500 | $29,000 | $55,500 |
| 2016 | $1,579 | $80,300 | $27,500 | $52,800 |
| 2015 | $1,460 | $74,200 | $27,500 | $46,700 |
Source: Public Records
Map
Nearby Homes
- 28 Porter St
- 35 Merrimac Ave
- 34 Savoy Ave Unit 36
- 73 Melville
- 33 Drexel St
- 17 Stuyvesant St
- 47 Victoria St
- 49 Upland St
- 143 Saint James Cir
- 878-880 Saint James Ave
- 884-886 Saint James Ave
- 890-892 Saint James Ave
- 52 Vadnais St
- 102 San Miguel St
- 83 Oklahoma St
- 148 Yale St
- 9 Utica St
- 27 Parallel St
- 59 Piedmont St
- 393 Saint James Ave
Your Personal Tour Guide
Ask me questions while you tour the home.