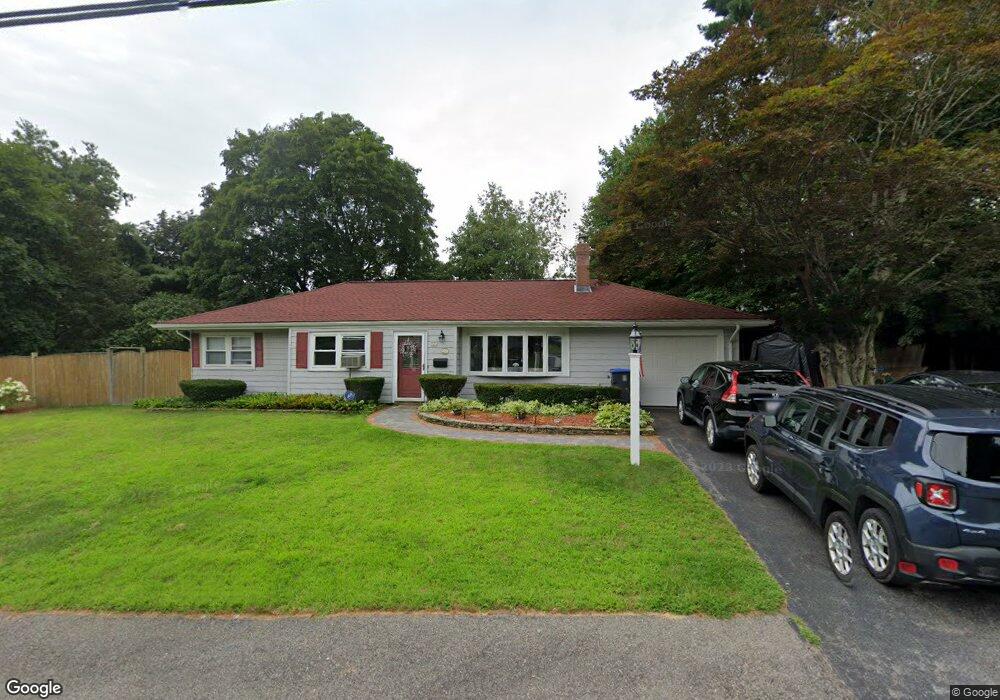
11 Appleton Rd Natick, MA 01760
Estimated Value: $726,000 - $1,013,000
3
Beds
3
Baths
1,408
Sq Ft
$609/Sq Ft
Est. Value
About This Home
This home is located at 11 Appleton Rd, Natick, MA 01760 and is currently estimated at $857,668, approximately $609 per square foot. 11 Appleton Rd is a home located in Middlesex County with nearby schools including Natick High School, Bennett-Hemenway (Ben-Hem) Elementary School, and Wilson Middle School.
Ownership History
Date
Name
Owned For
Owner Type
Purchase Details
Closed on
Aug 31, 1995
Sold by
Benowitz Allan B and Benowitz Valerie M
Bought by
Sugrue Michael J and Sugrue Maria E
Current Estimated Value
Purchase Details
Closed on
Dec 30, 1988
Sold by
Hamann Robert
Bought by
Benowitz Allan B
Create a Home Valuation Report for This Property
The Home Valuation Report is an in-depth analysis detailing your home's value as well as a comparison with similar homes in the area
Home Values in the Area
Average Home Value in this Area
Purchase History
| Date | Buyer | Sale Price | Title Company |
|---|---|---|---|
| Sugrue Michael J | $173,000 | -- | |
| Benowitz Allan B | $176,000 | -- |
Source: Public Records
Mortgage History
| Date | Status | Borrower | Loan Amount |
|---|---|---|---|
| Open | Benowitz Allan B | $207,000 | |
| Closed | Benowitz Allan B | $195,000 | |
| Closed | Benowitz Allan B | $175,000 |
Source: Public Records
Tax History
| Year | Tax Paid | Tax Assessment Tax Assessment Total Assessment is a certain percentage of the fair market value that is determined by local assessors to be the total taxable value of land and additions on the property. | Land | Improvement |
|---|---|---|---|---|
| 2025 | $7,706 | $644,300 | $462,200 | $182,100 |
| 2024 | $7,485 | $610,500 | $436,500 | $174,000 |
| 2023 | $7,279 | $575,900 | $409,700 | $166,200 |
| 2022 | $7,080 | $530,700 | $372,900 | $157,800 |
| 2021 | $5,073 | $500,600 | $352,500 | $148,100 |
| 2020 | $9,835 | $485,200 | $337,100 | $148,100 |
| 2019 | $4,225 | $485,200 | $337,100 | $148,100 |
| 2018 | $5,506 | $421,900 | $306,500 | $115,400 |
| 2017 | $4,146 | $386,400 | $273,100 | $113,300 |
| 2016 | $4,944 | $364,300 | $258,100 | $106,200 |
| 2015 | $4,896 | $354,300 | $258,100 | $96,200 |
Source: Public Records
Map
Nearby Homes
Your Personal Tour Guide
Ask me questions while you tour the home.