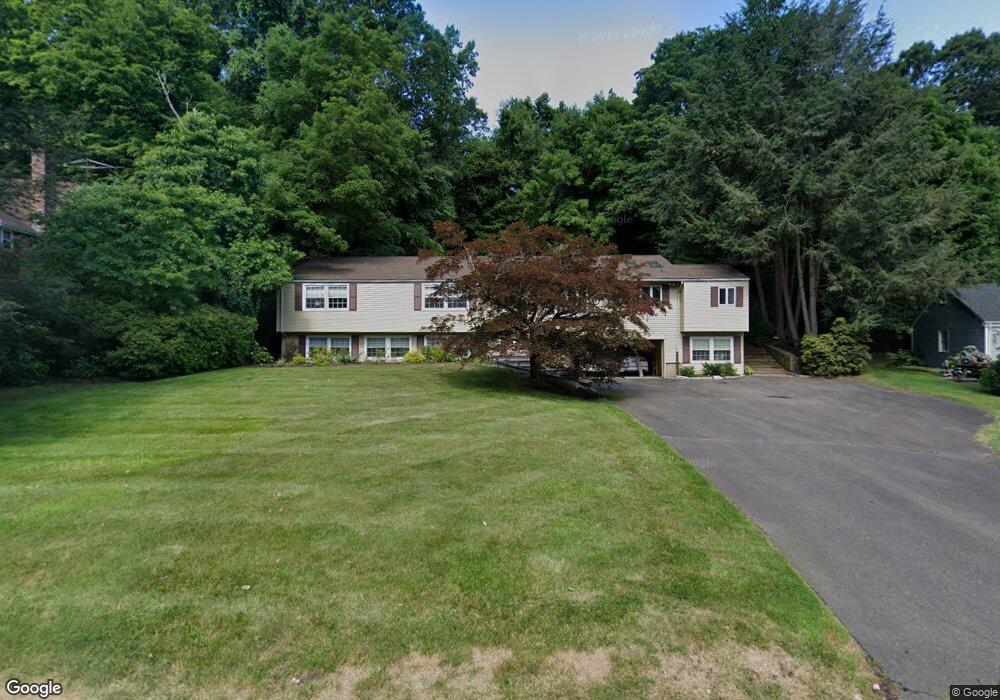
11 Arlen Way West Hartford, CT 06117
Estimated Value: $707,000 - $899,000
4
Beds
3
Baths
2,098
Sq Ft
$371/Sq Ft
Est. Value
About This Home
This home is located at 11 Arlen Way, West Hartford, CT 06117 and is currently estimated at $778,272, approximately $370 per square foot. 11 Arlen Way is a home located in Hartford County with nearby schools including Norfeldt School, King Philip Middle School, and Hall High School.
Ownership History
Date
Name
Owned For
Owner Type
Purchase Details
Closed on
Sep 10, 2004
Sold by
Chen Hong and Sun Lei
Bought by
Cendant Mobilit Fncl C
Current Estimated Value
Home Financials for this Owner
Home Financials are based on the most recent Mortgage that was taken out on this home.
Original Mortgage
$260,000
Outstanding Balance
$121,099
Interest Rate
4.99%
Estimated Equity
$657,173
Purchase Details
Closed on
Apr 14, 2003
Sold by
Katz Roy D and Katz Gail E
Bought by
Chen Hong and Sun Lei
Home Financials for this Owner
Home Financials are based on the most recent Mortgage that was taken out on this home.
Original Mortgage
$319,200
Interest Rate
5.86%
Purchase Details
Closed on
Apr 30, 1991
Sold by
Drew Donald and Drew Mary Jane
Bought by
Katz Roy and Katz Gail
Create a Home Valuation Report for This Property
The Home Valuation Report is an in-depth analysis detailing your home's value as well as a comparison with similar homes in the area
Home Values in the Area
Average Home Value in this Area
Purchase History
| Date | Buyer | Sale Price | Title Company |
|---|---|---|---|
| Cendant Mobilit Fncl C | $452,500 | -- | |
| Chen Hong | $399,000 | -- | |
| Katz Roy | $299,000 | -- |
Source: Public Records
Mortgage History
| Date | Status | Borrower | Loan Amount |
|---|---|---|---|
| Open | Katz Roy | $260,000 | |
| Previous Owner | Katz Roy | $319,200 | |
| Previous Owner | Katz Roy | $232,000 | |
| Previous Owner | Katz Roy | $250,725 |
Source: Public Records
Tax History Compared to Growth
Tax History
| Year | Tax Paid | Tax Assessment Tax Assessment Total Assessment is a certain percentage of the fair market value that is determined by local assessors to be the total taxable value of land and additions on the property. | Land | Improvement |
|---|---|---|---|---|
| 2025 | $12,946 | $289,100 | $89,460 | $199,640 |
| 2024 | $12,243 | $289,100 | $89,460 | $199,640 |
| 2023 | $11,830 | $289,100 | $89,460 | $199,640 |
| 2022 | $11,761 | $289,100 | $89,460 | $199,640 |
| 2021 | $10,731 | $252,980 | $89,460 | $163,520 |
| 2020 | $10,270 | $245,700 | $83,650 | $162,050 |
| 2019 | $10,264 | $245,560 | $83,650 | $161,910 |
| 2018 | $10,068 | $245,560 | $83,650 | $161,910 |
| 2017 | $10,078 | $245,560 | $83,650 | $161,910 |
| 2016 | $10,092 | $255,430 | $89,880 | $165,550 |
| 2015 | $9,786 | $255,430 | $89,880 | $165,550 |
| 2014 | $9,545 | $255,430 | $89,880 | $165,550 |
Source: Public Records
Map
Nearby Homes
- 124 Ferncliff Dr
- 25 Lakeview Dr
- 729 Mountain Rd
- 64 Avondale Rd
- 2 Ferncliff Dr
- 2 Chambord Park
- 94 Richmond Ln
- 21 Barksdale Rd
- 30 Biltmore Park Unit 30
- 592 Mountain Rd Unit A
- 11 Rye Ridge Pkwy
- 5 Coolidge Rd
- 124 High Ridge Rd
- 162 Balfour Dr
- 37 Balfour Dr
- 2581 Albany Ave
- 30 Farmstead Ln
- 15 Parsons Way
- 21 Rushleigh Rd
- 15 Rushleigh Rd
- 7 Arlen Way
- 15 Arlen Way
- 16 Northridge Dr
- 15 Northridge Dr
- 1 Arlen Way
- 17 Arlen Way
- 14 Arlen Way
- 41 Candlewood Dr
- 85 High Wood Rd
- 95 High Wood Rd
- 43 Candlewood Dr
- 36 Forest Hills Ln
- 21 Arlen Way
- 37 Candlewood Dr
- 81 High Wood Rd
- 14 Northridge Dr
- 30 Forest Hills Ln
- 99 High Wood Rd
- 25 Arlen Way
- 92 High Wood Rd