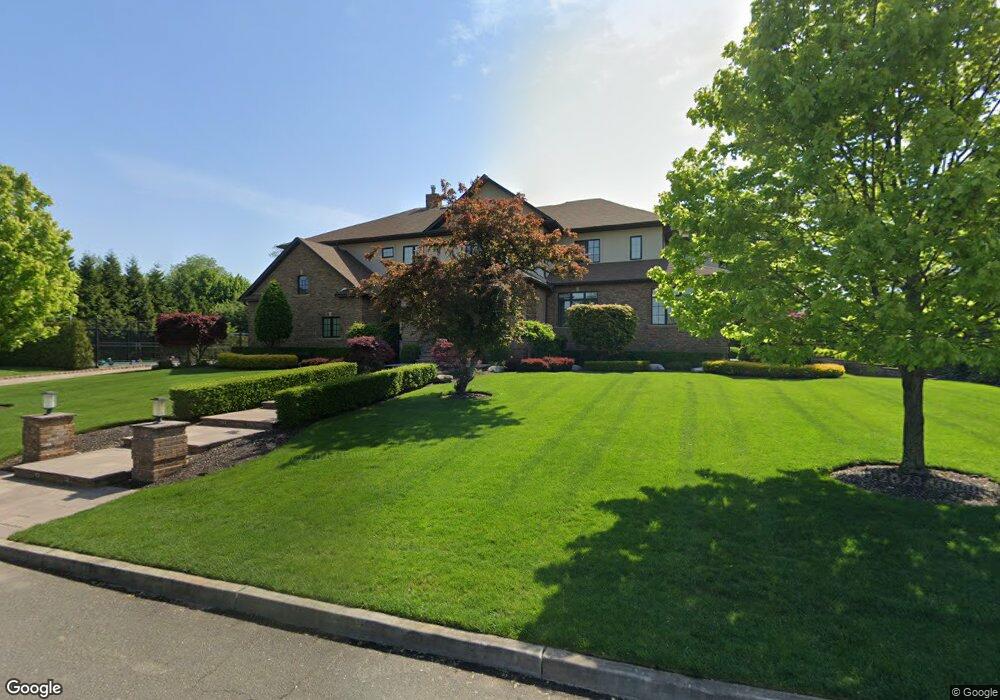
11 Ash St Unit 11 Monsey, NY 10952
Estimated Value: $1,238,000 - $3,435,000
10
Beds
4
Baths
8,216
Sq Ft
$251/Sq Ft
Est. Value
About This Home
This home is located at 11 Ash St Unit 11, Monsey, NY 10952 and is currently estimated at $2,062,585, approximately $251 per square foot. 11 Ash St Unit 11 is a home located in Rockland County with nearby schools including Grandview Elementary School, Pomona Middle School, and Ramapo High School.
Ownership History
Date
Name
Owned For
Owner Type
Purchase Details
Closed on
Jun 15, 2010
Sold by
Katz Tina R and Katz Sanford H
Bought by
Hollander Stuart D and Hollander Rivka
Current Estimated Value
Purchase Details
Closed on
Oct 19, 2007
Sold by
Pearson David
Bought by
Mcsherry Heather
Home Financials for this Owner
Home Financials are based on the most recent Mortgage that was taken out on this home.
Original Mortgage
$117,900
Interest Rate
5.75%
Mortgage Type
Purchase Money Mortgage
Purchase Details
Closed on
Mar 17, 2003
Sold by
Katz Tina R
Bought by
Katz Sanford H and Katz Tina R
Create a Home Valuation Report for This Property
The Home Valuation Report is an in-depth analysis detailing your home's value as well as a comparison with similar homes in the area
Home Values in the Area
Average Home Value in this Area
Purchase History
| Date | Buyer | Sale Price | Title Company |
|---|---|---|---|
| Hollander Stuart D | $569,000 | Chicago Title Insurance | |
| Mcsherry Heather | $147,387 | None Available | |
| Katz Sanford H | -- | -- |
Source: Public Records
Mortgage History
| Date | Status | Borrower | Loan Amount |
|---|---|---|---|
| Previous Owner | Mcsherry Heather | $117,900 |
Source: Public Records
Tax History Compared to Growth
Tax History
| Year | Tax Paid | Tax Assessment Tax Assessment Total Assessment is a certain percentage of the fair market value that is determined by local assessors to be the total taxable value of land and additions on the property. | Land | Improvement |
|---|---|---|---|---|
| 2024 | $40,372 | $169,400 | $20,400 | $149,000 |
| 2023 | $40,372 | $169,400 | $20,400 | $149,000 |
| 2022 | $39,370 | $169,400 | $20,400 | $149,000 |
| 2021 | $39,370 | $169,400 | $20,400 | $149,000 |
| 2020 | $39,650 | $169,400 | $20,400 | $149,000 |
| 2019 | $40,424 | $169,400 | $20,400 | $149,000 |
| 2018 | $40,424 | $168,500 | $20,400 | $148,100 |
| 2017 | $39,857 | $168,500 | $20,400 | $148,100 |
| 2016 | $39,470 | $168,500 | $20,400 | $148,100 |
| 2015 | -- | $168,500 | $20,400 | $148,100 |
| 2014 | -- | $83,600 | $20,400 | $63,200 |
Source: Public Records
Map
Nearby Homes