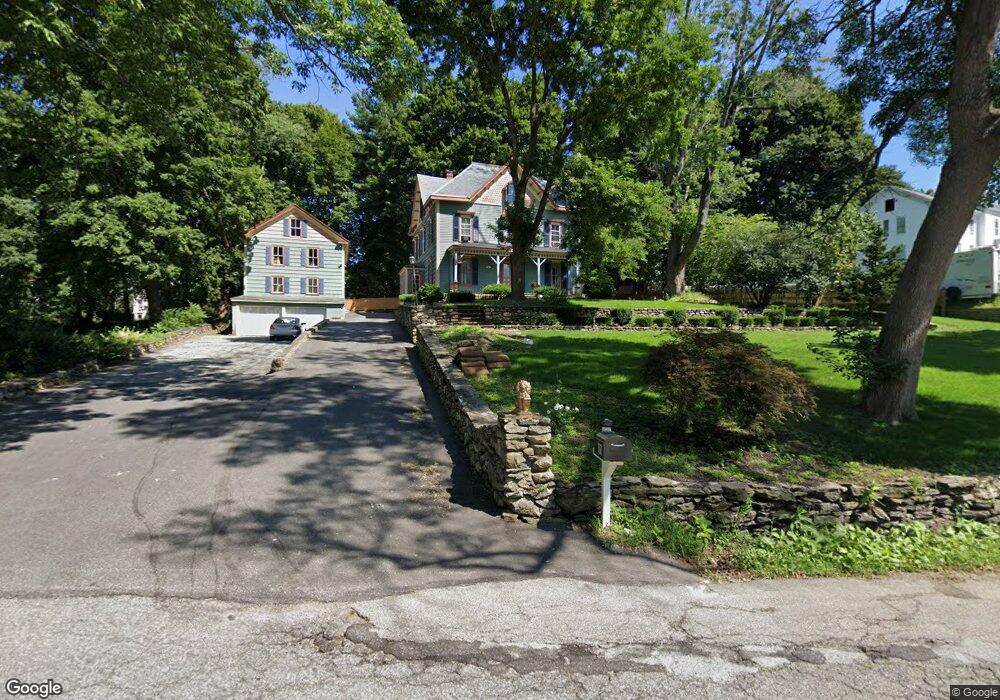
11 Ash St Unit 2 Spencer, MA 01562
Estimated Value: $488,757 - $618,000
3
Beds
1
Bath
1,100
Sq Ft
$519/Sq Ft
Est. Value
About This Home
This home is located at 11 Ash St Unit 2, Spencer, MA 01562 and is currently estimated at $571,439, approximately $519 per square foot. 11 Ash St Unit 2 is a home located in Worcester County with nearby schools including David Prouty High School.
Ownership History
Date
Name
Owned For
Owner Type
Purchase Details
Closed on
Jul 30, 2021
Sold by
Weagle Owen A and Anderson Valerie L
Bought by
Martinez Yamilka R and Williams-Garcia Maximo D
Current Estimated Value
Home Financials for this Owner
Home Financials are based on the most recent Mortgage that was taken out on this home.
Original Mortgage
$429,084
Outstanding Balance
$388,664
Interest Rate
2.93%
Mortgage Type
FHA
Estimated Equity
$182,775
Purchase Details
Closed on
Dec 30, 1992
Sold by
Scarglia August
Bought by
Hernandez Alvin and Aponte Maria A
Home Financials for this Owner
Home Financials are based on the most recent Mortgage that was taken out on this home.
Original Mortgage
$108,450
Interest Rate
8.32%
Mortgage Type
Purchase Money Mortgage
Create a Home Valuation Report for This Property
The Home Valuation Report is an in-depth analysis detailing your home's value as well as a comparison with similar homes in the area
Home Values in the Area
Average Home Value in this Area
Purchase History
| Date | Buyer | Sale Price | Title Company |
|---|---|---|---|
| Martinez Yamilka R | $442,000 | None Available | |
| Hernandez Alvin | $120,500 | -- |
Source: Public Records
Mortgage History
| Date | Status | Borrower | Loan Amount |
|---|---|---|---|
| Open | Martinez Yamilka R | $429,084 | |
| Previous Owner | Hernandez Alvin | $15,000 | |
| Previous Owner | Hernandez Alvin | $108,450 |
Source: Public Records
Tax History Compared to Growth
Tax History
| Year | Tax Paid | Tax Assessment Tax Assessment Total Assessment is a certain percentage of the fair market value that is determined by local assessors to be the total taxable value of land and additions on the property. | Land | Improvement |
|---|---|---|---|---|
| 2025 | $58 | $491,600 | $42,800 | $448,800 |
| 2024 | $5,389 | $471,100 | $42,800 | $428,300 |
| 2023 | $5,094 | $422,400 | $42,800 | $379,600 |
| 2022 | $4,091 | $310,900 | $38,900 | $272,000 |
| 2021 | $3,538 | $252,000 | $38,900 | $213,100 |
| 2020 | $3,444 | $243,900 | $38,900 | $205,000 |
| 2019 | $3,186 | $229,900 | $35,200 | $194,700 |
| 2018 | $2,806 | $209,100 | $40,900 | $168,200 |
| 2017 | $2,895 | $207,100 | $38,900 | $168,200 |
| 2016 | $2,737 | $191,500 | $38,900 | $152,600 |
| 2015 | $2,707 | $198,000 | $43,200 | $154,800 |
| 2014 | $2,604 | $198,000 | $43,200 | $154,800 |
Source: Public Records
Map
Nearby Homes