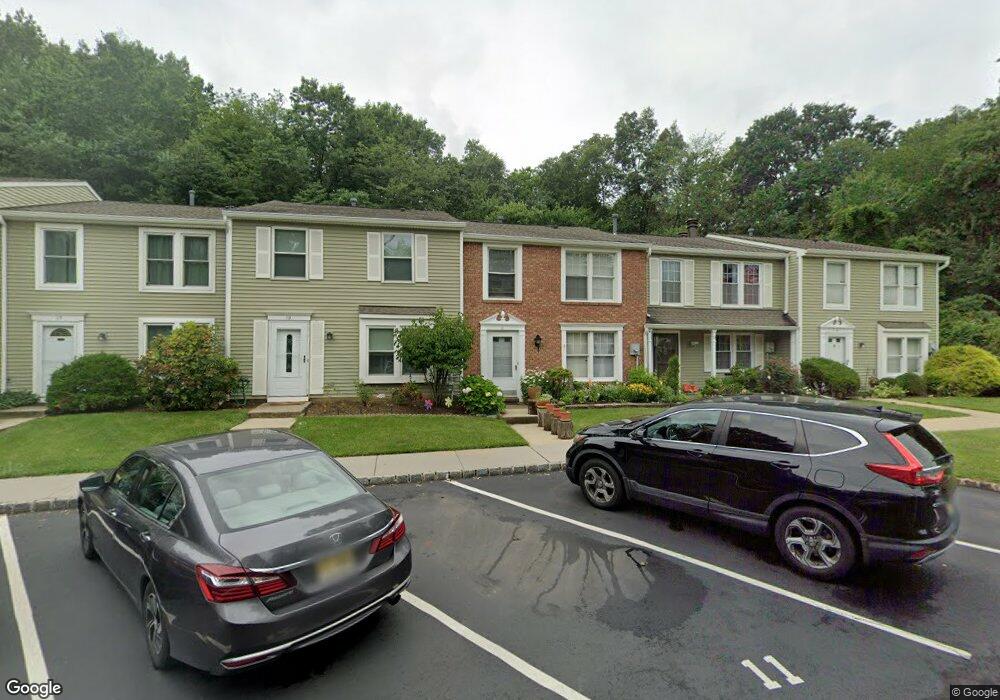
11 Aspen Ct Unit 20C Monmouth Junction, NJ 08852
Estimated Value: $390,626 - $422,000
3
Beds
3
Baths
1,280
Sq Ft
$315/Sq Ft
Est. Value
About This Home
This home is located at 11 Aspen Ct Unit 20C, Monmouth Junction, NJ 08852 and is currently estimated at $402,907, approximately $314 per square foot. 11 Aspen Ct Unit 20C is a home located in Middlesex County with nearby schools including Constable Elementary School, Crossroads North Middle School, and South Brunswick High School.
Ownership History
Date
Name
Owned For
Owner Type
Purchase Details
Closed on
Sep 19, 2014
Sold by
Latif Saqib and Shah Shabana
Bought by
Han Sang Chul and Han Jong Mae
Current Estimated Value
Home Financials for this Owner
Home Financials are based on the most recent Mortgage that was taken out on this home.
Original Mortgage
$192,150
Interest Rate
4.18%
Mortgage Type
New Conventional
Purchase Details
Closed on
May 28, 2009
Sold by
Meghnagi Alfonso
Bought by
Latif Saqib and Shah Shabana
Home Financials for this Owner
Home Financials are based on the most recent Mortgage that was taken out on this home.
Original Mortgage
$227,920
Interest Rate
4.82%
Mortgage Type
FHA
Purchase Details
Closed on
Sep 3, 2008
Sold by
Lowerre Marilyn and Lowerre Patricia
Bought by
Meghnagi Alfonso
Create a Home Valuation Report for This Property
The Home Valuation Report is an in-depth analysis detailing your home's value as well as a comparison with similar homes in the area
Home Values in the Area
Average Home Value in this Area
Purchase History
| Date | Buyer | Sale Price | Title Company |
|---|---|---|---|
| Han Sang Chul | $213,500 | Agent For First Amer Title I | |
| Latif Saqib | $239,000 | Multiple | |
| Meghnagi Alfonso | $194,530 | Sterling Title Agency |
Source: Public Records
Mortgage History
| Date | Status | Borrower | Loan Amount |
|---|---|---|---|
| Previous Owner | Han Sang Chul | $192,150 | |
| Previous Owner | Latif Saqib | $227,920 |
Source: Public Records
Tax History Compared to Growth
Tax History
| Year | Tax Paid | Tax Assessment Tax Assessment Total Assessment is a certain percentage of the fair market value that is determined by local assessors to be the total taxable value of land and additions on the property. | Land | Improvement |
|---|---|---|---|---|
| 2025 | $5,065 | $93,000 | $50,000 | $43,000 |
| 2024 | $4,883 | $93,000 | $50,000 | $43,000 |
| 2023 | $4,883 | $93,000 | $50,000 | $43,000 |
| 2022 | $4,739 | $93,000 | $50,000 | $43,000 |
| 2021 | $3,342 | $93,000 | $50,000 | $43,000 |
| 2020 | $4,765 | $93,000 | $50,000 | $43,000 |
| 2019 | $4,807 | $93,000 | $50,000 | $43,000 |
| 2018 | $4,650 | $93,000 | $50,000 | $43,000 |
| 2017 | $4,643 | $93,000 | $50,000 | $43,000 |
| 2016 | $4,593 | $93,000 | $50,000 | $43,000 |
| 2015 | $4,454 | $93,000 | $50,000 | $43,000 |
| 2014 | $4,382 | $93,000 | $50,000 | $43,000 |
Source: Public Records
Map
Nearby Homes