Estimated Value: $374,000 - $923,000
--
Bed
--
Bath
560
Sq Ft
$1,239/Sq Ft
Est. Value
About This Home
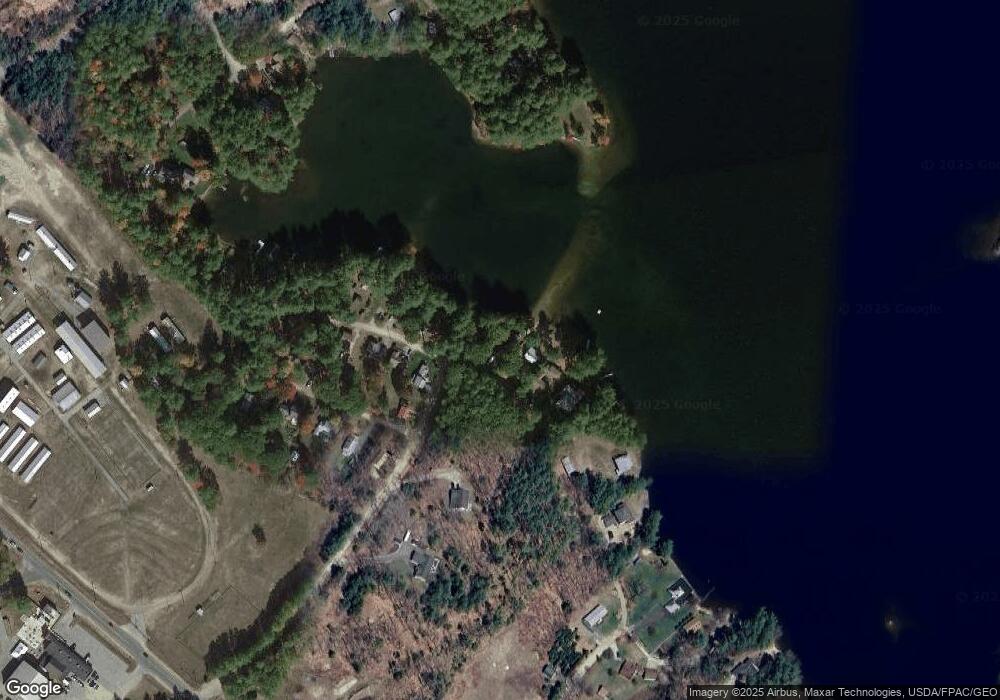
This home is located at 11 Aspen Ln, Acton, ME 04001 and is currently estimated at $693,703, approximately $1,238 per square foot. 11 Aspen Ln is a home located in York County with nearby schools including Acton Elementary School.
Ownership History
Date
Name
Owned For
Owner Type
Purchase Details
Closed on
Jun 1, 2016
Sold by
Robert S Mazeika Ret
Bought by
Peters Samuel R and Peters Lorissa M
Current Estimated Value
Home Financials for this Owner
Home Financials are based on the most recent Mortgage that was taken out on this home.
Original Mortgage
$175,000
Outstanding Balance
$139,371
Interest Rate
3.59%
Mortgage Type
Commercial
Estimated Equity
$554,332
Purchase Details
Closed on
Oct 6, 2015
Sold by
Mazeika Robert S and Mazeika Jeannine S
Bought by
Robert S Mazeika Ret
Create a Home Valuation Report for This Property
The Home Valuation Report is an in-depth analysis detailing your home's value as well as a comparison with similar homes in the area
Home Values in the Area
Average Home Value in this Area
Purchase History
| Date | Buyer | Sale Price | Title Company |
|---|---|---|---|
| Peters Samuel R | -- | -- | |
| Robert S Mazeika Ret | -- | -- |
Source: Public Records
Mortgage History
| Date | Status | Borrower | Loan Amount |
|---|---|---|---|
| Open | Peters Samuel R | $175,000 |
Source: Public Records
Tax History Compared to Growth
Tax History
| Year | Tax Paid | Tax Assessment Tax Assessment Total Assessment is a certain percentage of the fair market value that is determined by local assessors to be the total taxable value of land and additions on the property. | Land | Improvement |
|---|---|---|---|---|
| 2024 | $5,538 | $783,315 | $538,700 | $244,615 |
| 2023 | $5,052 | $783,315 | $538,700 | $244,615 |
| 2022 | $4,302 | $359,994 | $215,480 | $144,514 |
| 2021 | $4,302 | $359,994 | $215,480 | $144,514 |
| 2020 | $4,338 | $359,994 | $215,480 | $144,514 |
| 2019 | $4,338 | $359,994 | $215,480 | $144,514 |
| 2018 | $4,338 | $359,994 | $215,480 | $144,514 |
| 2017 | $4,153 | $349,026 | $215,480 | $133,546 |
| 2016 | $3,927 | $349,026 | $215,480 | $133,546 |
| 2015 | $4,031 | $349,026 | $215,480 | $133,546 |
| 2014 | $3,874 | $349,026 | $215,480 | $133,546 |
Source: Public Records
Map
Nearby Homes