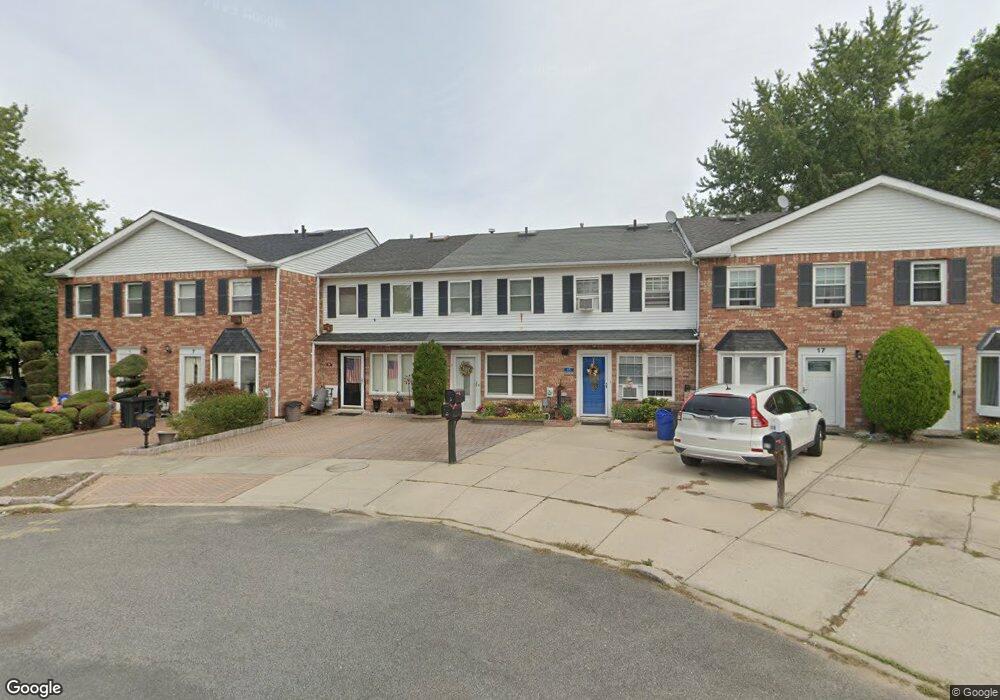
11 Atmore Place Staten Island, NY 10306
Great Kills NeighborhoodEstimated Value: $551,000 - $607,000
2
Beds
2
Baths
1,140
Sq Ft
$499/Sq Ft
Est. Value
About This Home
This home is located at 11 Atmore Place, Staten Island, NY 10306 and is currently estimated at $568,739, approximately $498 per square foot. 11 Atmore Place is a home located in Richmond County with nearby schools including P.S. 50 Frank Hankinson School, Myra S. Barnes Intermediate School 24, and Susan E Wagner High School.
Ownership History
Date
Name
Owned For
Owner Type
Purchase Details
Closed on
Oct 20, 2005
Sold by
Debanich Yelena
Bought by
Torres Martha
Current Estimated Value
Home Financials for this Owner
Home Financials are based on the most recent Mortgage that was taken out on this home.
Original Mortgage
$297,000
Outstanding Balance
$162,755
Interest Rate
6.14%
Mortgage Type
Fannie Mae Freddie Mac
Estimated Equity
$405,984
Purchase Details
Closed on
Oct 4, 1999
Sold by
Cagliostro John and Cagliostro Lorraine
Bought by
Debanich Yelena
Home Financials for this Owner
Home Financials are based on the most recent Mortgage that was taken out on this home.
Original Mortgage
$144,000
Interest Rate
7.84%
Create a Home Valuation Report for This Property
The Home Valuation Report is an in-depth analysis detailing your home's value as well as a comparison with similar homes in the area
Home Values in the Area
Average Home Value in this Area
Purchase History
| Date | Buyer | Sale Price | Title Company |
|---|---|---|---|
| Torres Martha | $330,000 | None Available | |
| Debanich Yelena | $160,000 | Lawyers Title Insurance Corp |
Source: Public Records
Mortgage History
| Date | Status | Borrower | Loan Amount |
|---|---|---|---|
| Open | Torres Martha | $297,000 | |
| Previous Owner | Debanich Yelena | $144,000 |
Source: Public Records
Tax History Compared to Growth
Tax History
| Year | Tax Paid | Tax Assessment Tax Assessment Total Assessment is a certain percentage of the fair market value that is determined by local assessors to be the total taxable value of land and additions on the property. | Land | Improvement |
|---|---|---|---|---|
| 2025 | $4,632 | $31,080 | $4,625 | $26,455 |
| 2024 | $4,644 | $31,440 | $4,388 | $27,052 |
| 2023 | $4,403 | $23,078 | $4,347 | $18,731 |
| 2022 | $4,060 | $26,580 | $5,640 | $20,940 |
| 2021 | $4,279 | $26,940 | $5,640 | $21,300 |
| 2020 | $4,200 | $24,960 | $5,640 | $19,320 |
| 2019 | $3,971 | $25,560 | $5,640 | $19,920 |
| 2018 | $3,623 | $19,232 | $5,036 | $14,196 |
| 2017 | $3,399 | $18,144 | $4,901 | $13,243 |
| 2016 | $3,317 | $18,144 | $4,901 | $13,243 |
| 2015 | $2,955 | $17,700 | $4,920 | $12,780 |
| 2014 | $2,955 | $16,988 | $4,552 | $12,436 |
Source: Public Records
Map
Nearby Homes
- 38 Corona Ave
- 27 Corona Ave
- 15 Corona Ave
- 50 Dina Ct
- 140 Corona Ave
- 98 Cotter Ave
- 92 Boyce Ave
- 8 Croft Ct
- 41 Croft Ct
- 168 Cotter Ave
- 25 Fuller Ct Unit A
- 274 Wilder Ave
- 256 Thomas St
- 260 Thomas St
- 268 Thomas St
- 159 Thomas St
- 236 Amber St
- 16 Savoy St Unit 16
- 14 Savoy St Unit 14
- 100 Savoy St Unit 1, 39, 43, 45, 46