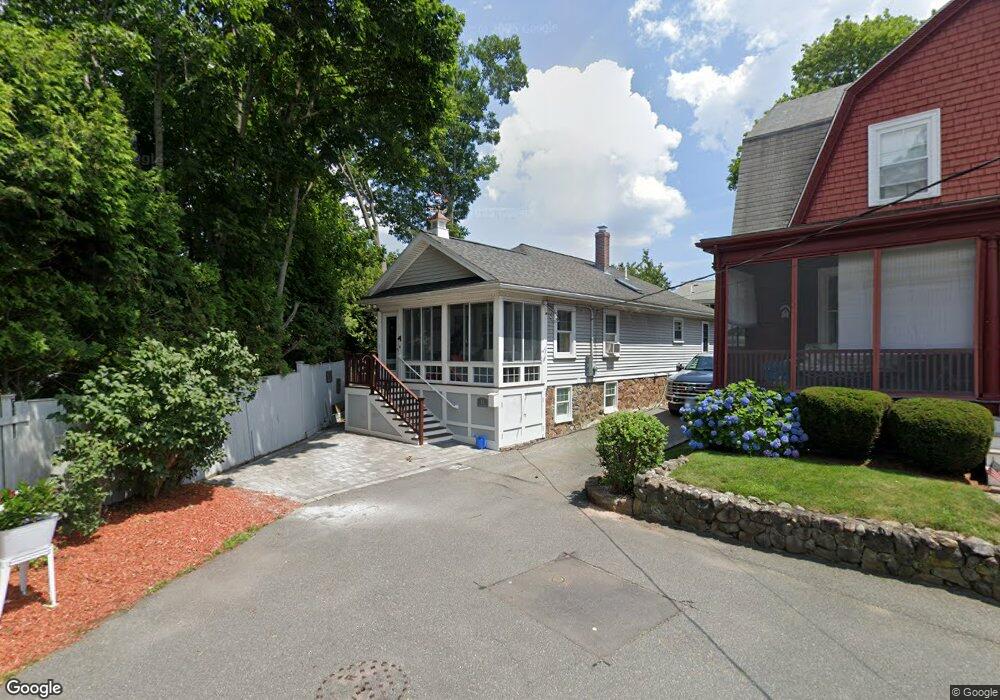
11 Aycliffe Rd Swampscott, MA 01907
Estimated Value: $669,000 - $855,000
2
Beds
2
Baths
1,095
Sq Ft
$691/Sq Ft
Est. Value
About This Home
This home is located at 11 Aycliffe Rd, Swampscott, MA 01907 and is currently estimated at $757,097, approximately $691 per square foot. 11 Aycliffe Rd is a home located in Essex County with nearby schools including Swampscott Middle School, Swampscott High School, and Epstein Hillel School.
Ownership History
Date
Name
Owned For
Owner Type
Purchase Details
Closed on
Dec 8, 2016
Sold by
Johnson Jacqueline
Bought by
Johnson Jacqueline and Johnson Dennis
Current Estimated Value
Purchase Details
Closed on
Apr 1, 1996
Sold by
Halsey Douglas D and Halsey Deadra
Bought by
Giguere Jacqueline
Home Financials for this Owner
Home Financials are based on the most recent Mortgage that was taken out on this home.
Original Mortgage
$99,000
Interest Rate
6.9%
Mortgage Type
Purchase Money Mortgage
Purchase Details
Closed on
Sep 29, 1988
Sold by
Gookin Patricia
Bought by
Halsey Douglas D
Create a Home Valuation Report for This Property
The Home Valuation Report is an in-depth analysis detailing your home's value as well as a comparison with similar homes in the area
Home Values in the Area
Average Home Value in this Area
Purchase History
We collect this data history from publicly available records. To have your information removed, we recommend requesting removal directly through your county’s website.
| Date | Buyer | Sale Price | Title Company |
|---|---|---|---|
| Johnson Jacqueline | -- | -- | |
| Johnson Jacqueline | -- | -- | |
| Giguere Jacqueline | $133,000 | -- | |
| Giguere Jacqueline | $133,000 | -- | |
| Halsey Douglas D | $163,000 | -- |
Source: Public Records
Mortgage History
We collect this data history from publicly available records. To have your information removed, we recommend requesting removal directly through your county’s website.
| Date | Status | Borrower | Loan Amount |
|---|---|---|---|
| Previous Owner | Halsey Douglas D | $180,000 | |
| Previous Owner | Halsey Douglas D | $40,000 | |
| Previous Owner | Halsey Douglas D | $99,000 |
Source: Public Records
Tax History
| Year | Tax Paid | Tax Assessment Tax Assessment Total Assessment is a certain percentage of the fair market value that is determined by local assessors to be the total taxable value of land and additions on the property. | Land | Improvement |
|---|---|---|---|---|
| 2025 | $8,154 | $710,900 | $334,400 | $376,500 |
| 2024 | $8,080 | $703,200 | $334,400 | $368,800 |
| 2023 | $7,613 | $648,500 | $301,800 | $346,700 |
| 2022 | $7,089 | $552,500 | $261,000 | $291,500 |
| 2021 | $7,052 | $511,000 | $236,500 | $274,500 |
| 2020 | $6,837 | $478,100 | $212,100 | $266,000 |
| 2019 | $6,285 | $413,500 | $195,800 | $217,700 |
| 2018 | $6,354 | $397,100 | $179,400 | $217,700 |
| 2017 | $6,259 | $358,700 | $156,600 | $202,100 |
| 2016 | $5,948 | $343,200 | $156,600 | $186,600 |
| 2015 | $5,886 | $343,200 | $156,600 | $186,600 |
| 2014 | $5,604 | $299,700 | $146,800 | $152,900 |
Source: Public Records
Map
Nearby Homes
- 2 Ocean Ave
- 21 Phillips Ave
- 20 Ocean Ave
- 128 Ocean Ave
- 45 Forest Ave
- 11 Laurel Rd
- 212 Humphrey St Unit 202
- 1008 Paradise Rd Unit 2E
- 1008 Paradise Rd Unit 3N
- 1002 Paradise Rd Unit PHE
- 21 Leggs Hill Rd
- 39 Clifton Ave
- 11 Angenica Terrace
- 18 Rose Ave
- 411 Atlantic Ave Unit 2
- 49 Ocean View Rd
- 18 America Way Unit 1
- 5 Lexington Park
- 35 Littles Point Rd Unit S201
- 20 America Way Unit 1
Your Personal Tour Guide
Ask me questions while you tour the home.